
 Home
Home News
News

- Ether Stock Price is unable to maintain its sustainability over the price level of 200 which can be an indication of a violent downfall.
- The ETH/BTC pair is also performing negative with the overall loss of –0.08% bringing the level to 0.02533790.
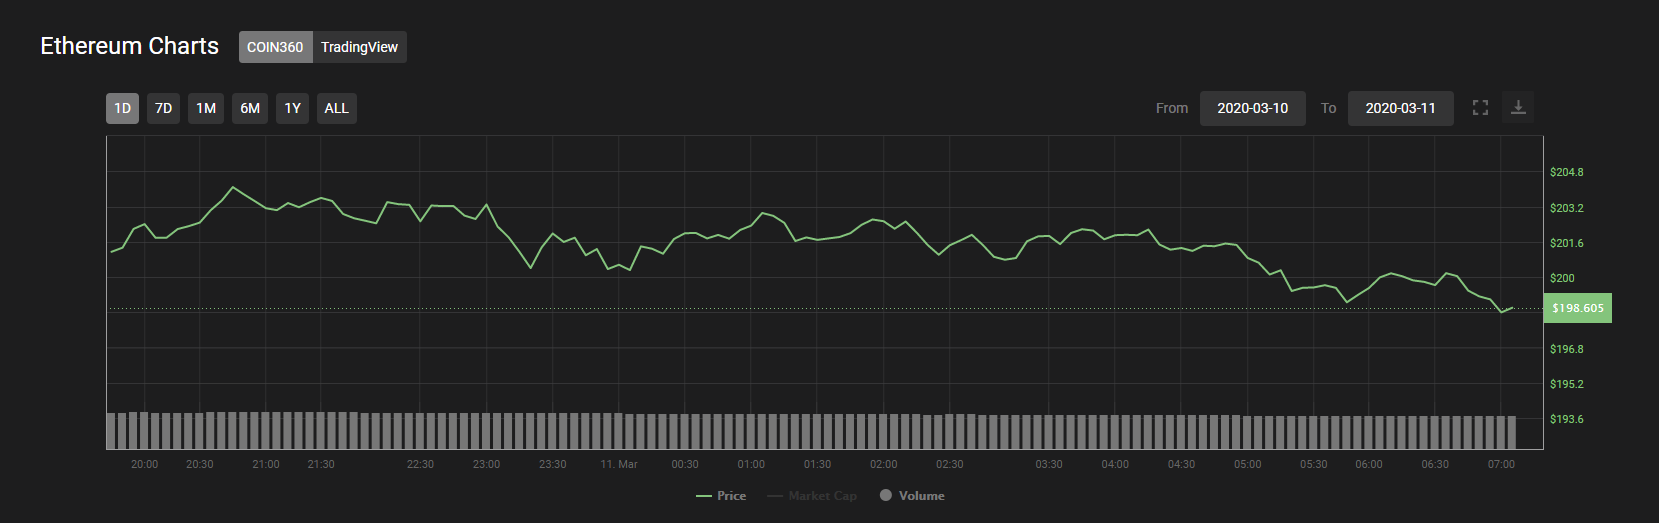
On the 7day – weekly chart, Ether started with the support level of $220. With the bullish momentum, it went up to a strong support level of $245. It attempted to cross the crucial level of 250 but failed miserably.

The resistance level of $250 provided a minor bearish moment to the crypto asset which was later supported by the price level of 230. However, the overall crypto market forces had something else to offer to the second largest crypto asset in the world.

The heavy downfall of Monday’s market force the crypto asset to touch the crucial and lower level of this year, i.e, $200. This has brought major concern among the crypto traders about the future movement of Ether.
Currently, the price level is below the crucial mark of $200 which is not a positive sign for ether holder. The market capitalization is $21,935,161,699 with the volume traded of $17,256,548,187. The circulating supply is 110,470,424 ETH. The ETH/BTC pair is still moving between the level of 0.025 and 0.027.
Ethereum Technical Analysis
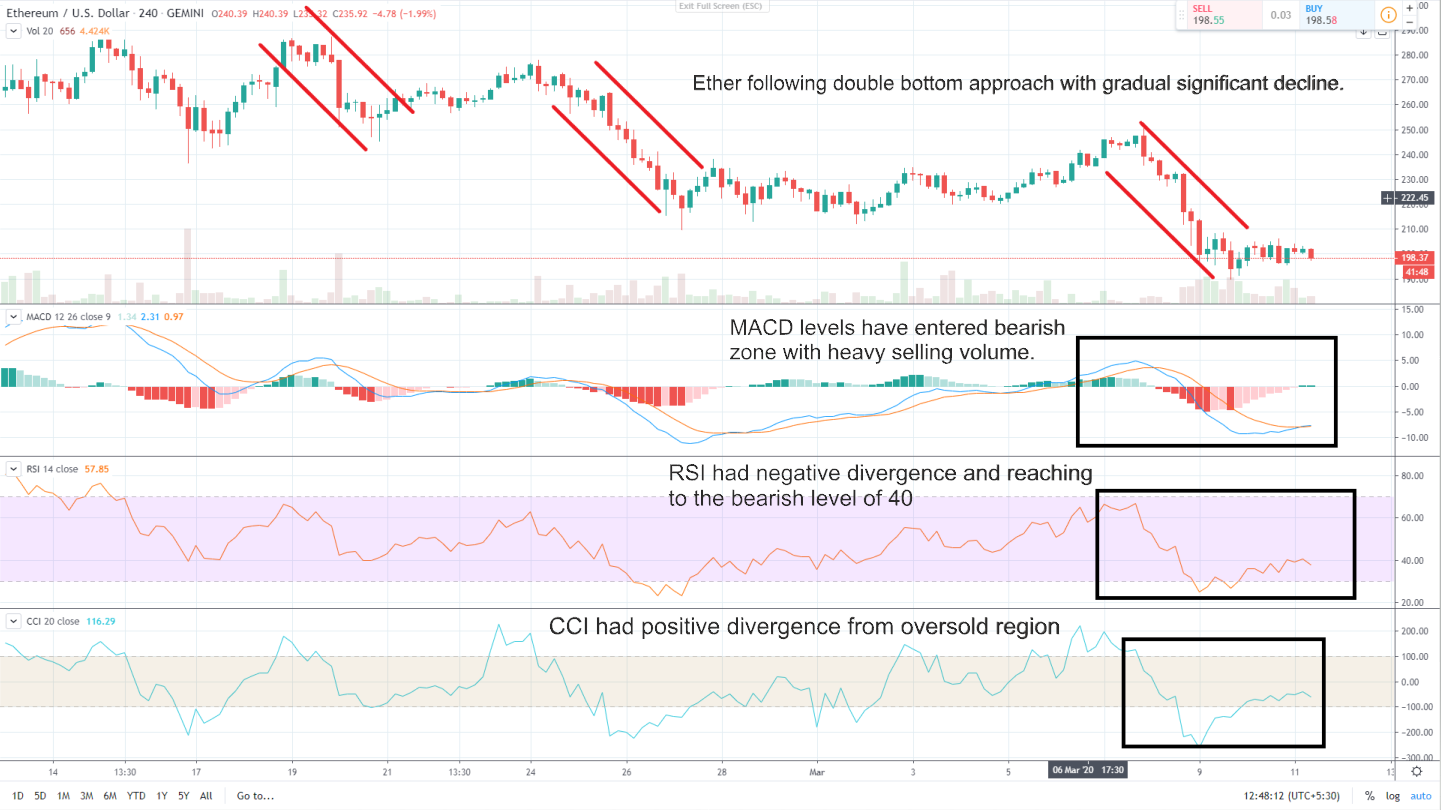
The technical chart reflects on the downtrend in the price of Ethereum significantly starting from this month. The downtrend has followed the double-bottom approach which means that the decline in the price has been gradual.
The technical indicators and oscillators are somehow on neutral ground as Ether price is showing volatility on the price mark of $200.
The MACD levels are again in the bearish zone due to the significant downfall for the past 2 days.
The 24hr – RSI is also having negative diversion to the bearish level of 40. It is also showing down-trending nature which is a negative sign for the coin.
However, the 24hr – CCI had positive diversion from the oversold region which indicates that there is still some buying volume left for the crypto asset.
Resistance level: $210 and $220
Support level $200 and $195
Mr. Pratik chadhokar is an Indian Forex, Cryptocurrencies and Financial Market Advisor and analyst with a background in IT and Financial market Strategist. He specialises in market strategies and technical analysis and has spent over a year as a financial markets contributor and observer. He possesses strong technical analytical skills and is well known for his entertaining and informative analysis of the Financial markets.


