
 Home
Home News
News

- Stellar (XLM) is unable to maintain a price sustainability on the crucial normal level which can lead to further downfall.
- The XLM/BTC level is also performing negatively with the overall loss of -3.70% bringing the level to 0.00000691.
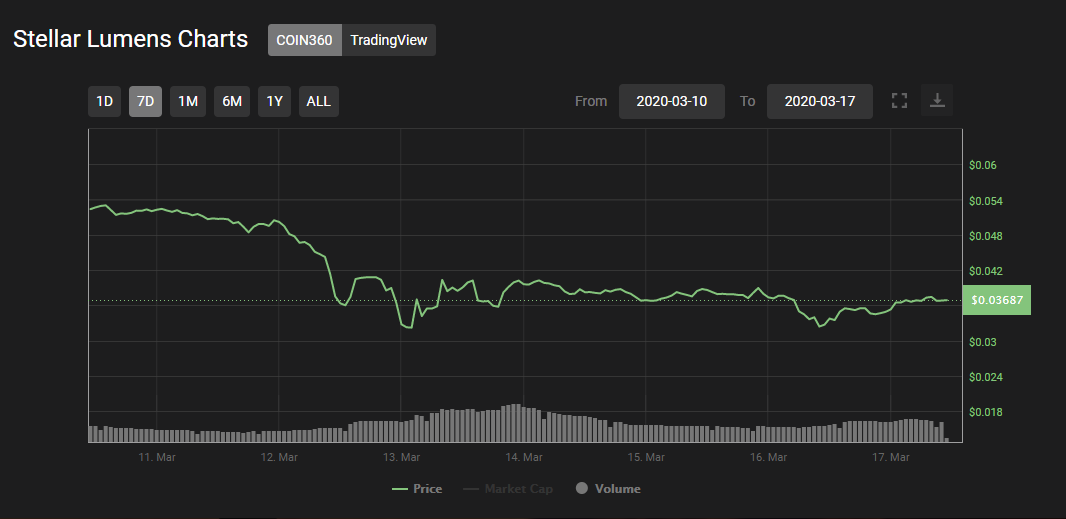

The 7day-weekly chart reflects that there is a major bearish momentum in the prices of the cryptocurrency. Stellar started its day with a strong support of $0.350, which provide it a support to reach the crucial normal level.

There is a strong resistance of 0.380 which didn’t allow prices to make further climb, and also pushed them down below the crucial normal level
The down trending nature of the market is making prices of cryptocurrency very venerable to the price volatility.
Currently, the market capitalization is at $738,629,995 USD with the volume traded of $391,480,601 with the market circulating supply of 50,001,803,906 XLM
Stellar(XLM) Technical Analysis:
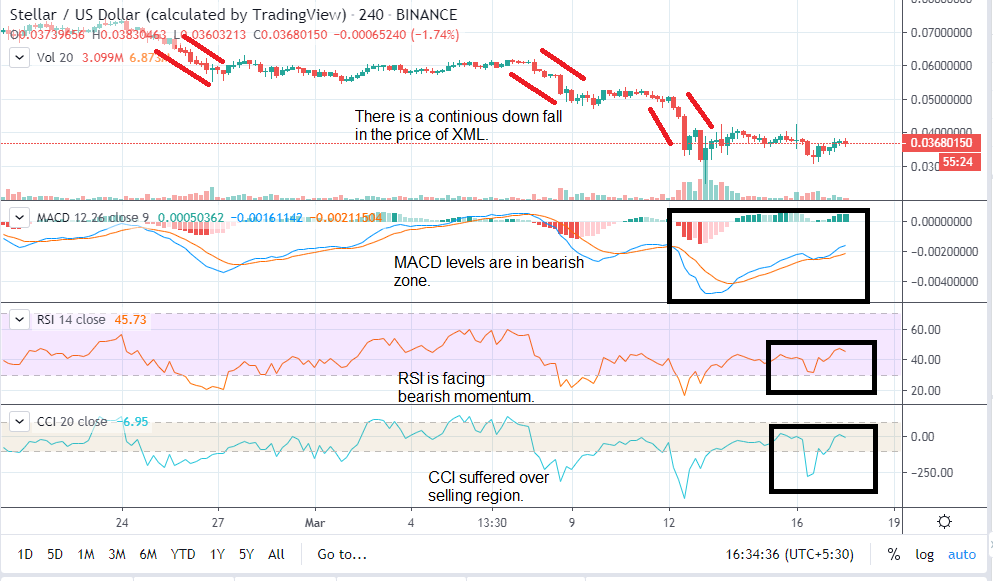
The technical chart indicates the downtrend in the prices of Stellar continuously from the starting of the month. There is a heavy bearish dominance in the market as prices are struggling to maintain a gradual climb. Prices are kept on falling or struggling, this is a negative sign for the crypto investors.
The technical indicators and oscillators are showing heavy selling volume of the XLM as people are concerned with liquefying their assets due to the current market condition.
The MACD levels are in bearish zone due to the excessive selling of cryptocurrency which is affecting its price at best and not allowing it to have a gradual climb.
RSI is facing heavy volatility in the bearish zone of the normal level due to the selling volume of the cryptocurrency.
The 24hr-CCI touched the bottom of the overselling region but took a positive divergent and climbed back to the normal region.
Resistance Level: $ 0.037
Support Level: $0.036
Mr. Pratik chadhokar is an Indian Forex, Cryptocurrencies and Financial Market Advisor and analyst with a background in IT and Financial market Strategist. He specialises in market strategies and technical analysis and has spent over a year as a financial markets contributor and observer. He possesses strong technical analytical skills and is well known for his entertaining and informative analysis of the Financial markets.


