
 Home
Home News
News

- NEO prices are signaling the bearish continuation as bulls are unable to find a break, rings bell for a further downfall.
- NEO/BTC pair is also performing negative with the loss of -0.95%, bringing the level to 0.00105042.
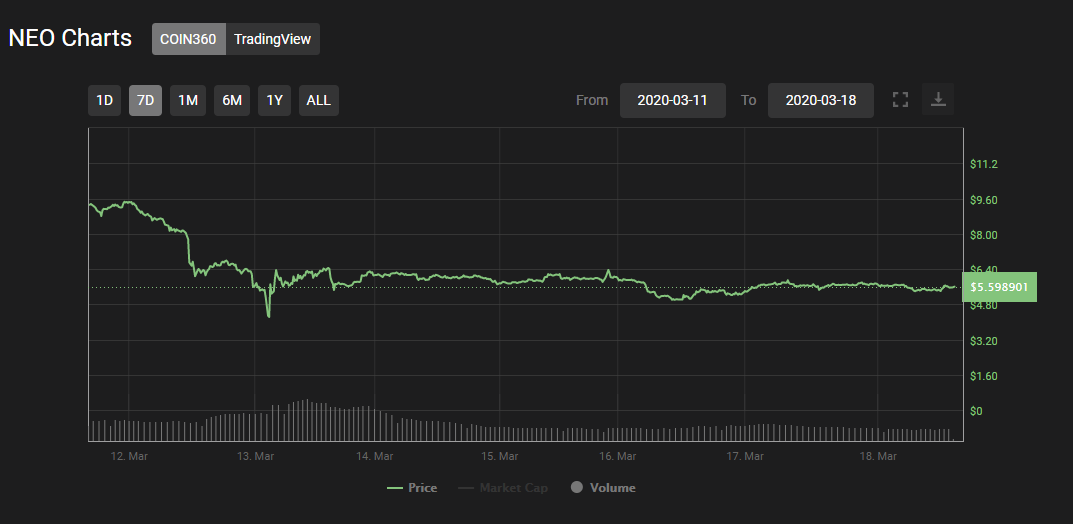

The 7day-weekly chart reflects that bears are entirely in charge of the prices.

The bulls have the strong support of $4.80, which is not allowing bears to push down the prices furthermore. There might be chances that this support level can be the key figure to acquire bullish momentum.
If prices manage to break off the crucial resistance level of $6.40, there will be massive bullish dominance in the prices of NEO. Prices did tried to break this crucial resistance level but failed miserably and started falling again.
The market capitalization of NEO is $387,889,085, with volume traded of $446,323,165 and a circulating supply of 70,538,831 NEO.
Neo (NEO) Technical Analysis:
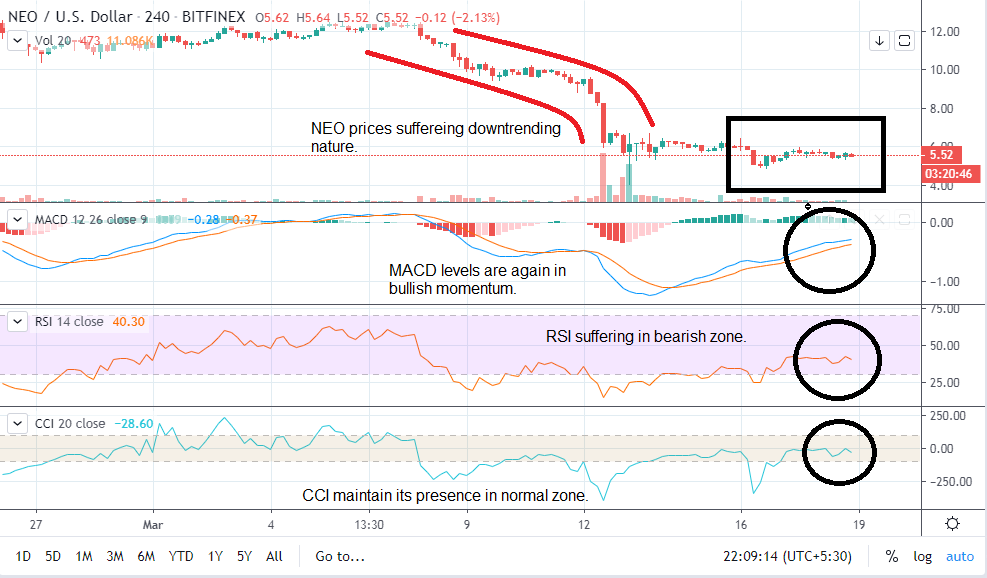
The technical chart indicates that the market is prone to the down-trending nature, and bulls run out of the steam.
NEO prices suffered a gradual downfall and currently stumbling due to the volatile prices. The current situation of NEO indicates that there can be further dive into the prices.
MACD level indicates that there is an increase in buying volume, which is a positive sign for NEO.
However, 24hour RSI was facing a bearish zone and was unable to show any signs of positive divergence towards the bullish region.
The 24hr-CCI moving in the normal region with minor ups and downs.
Resistance Level $ 5.70
Support Level $ 5.40
Mr. Pratik chadhokar is an Indian Forex, Cryptocurrencies and Financial Market Advisor and analyst with a background in IT and Financial market Strategist. He specialises in market strategies and technical analysis and has spent over a year as a financial markets contributor and observer. He possesses strong technical analytical skills and is well known for his entertaining and informative analysis of the Financial markets.


