
 Home
Home News
News

- Chainlink showed a significant positive momentum in today’s market with 4.12% growth.
- The cryptoasset has also reclaimed the crucial mark of $2.00 indicating future bullish movement.
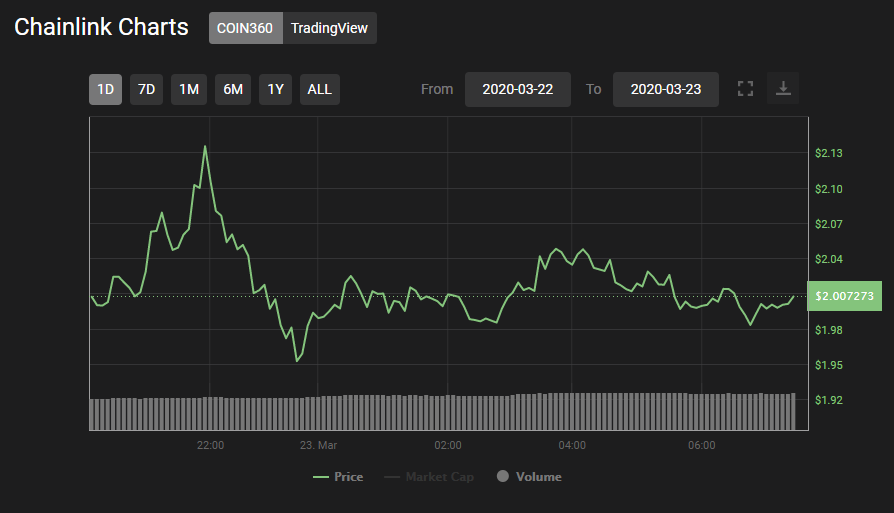
On the 7day-weekly chart, Chainlink started with the critical level of $1.90 and the overall bearish movement in the market has brought the price of the altcoin into major critical points.

The cryptoasset went down to the lowest of $1.70 where it found major support and now the price level is back again to a safe spot of $2.00

From here on, chainlink can sustain the price mark of $2.00 and build on bullish momentum to the level of $3.00. However, it will be facing a minor resistance of $2.70 in the price growth process.
As of now, chainlink is now having a strong support level of $2.00. Any price fall below the price mark will again result in a major downfall for the altcoin.
Chainlink Technical Analysis
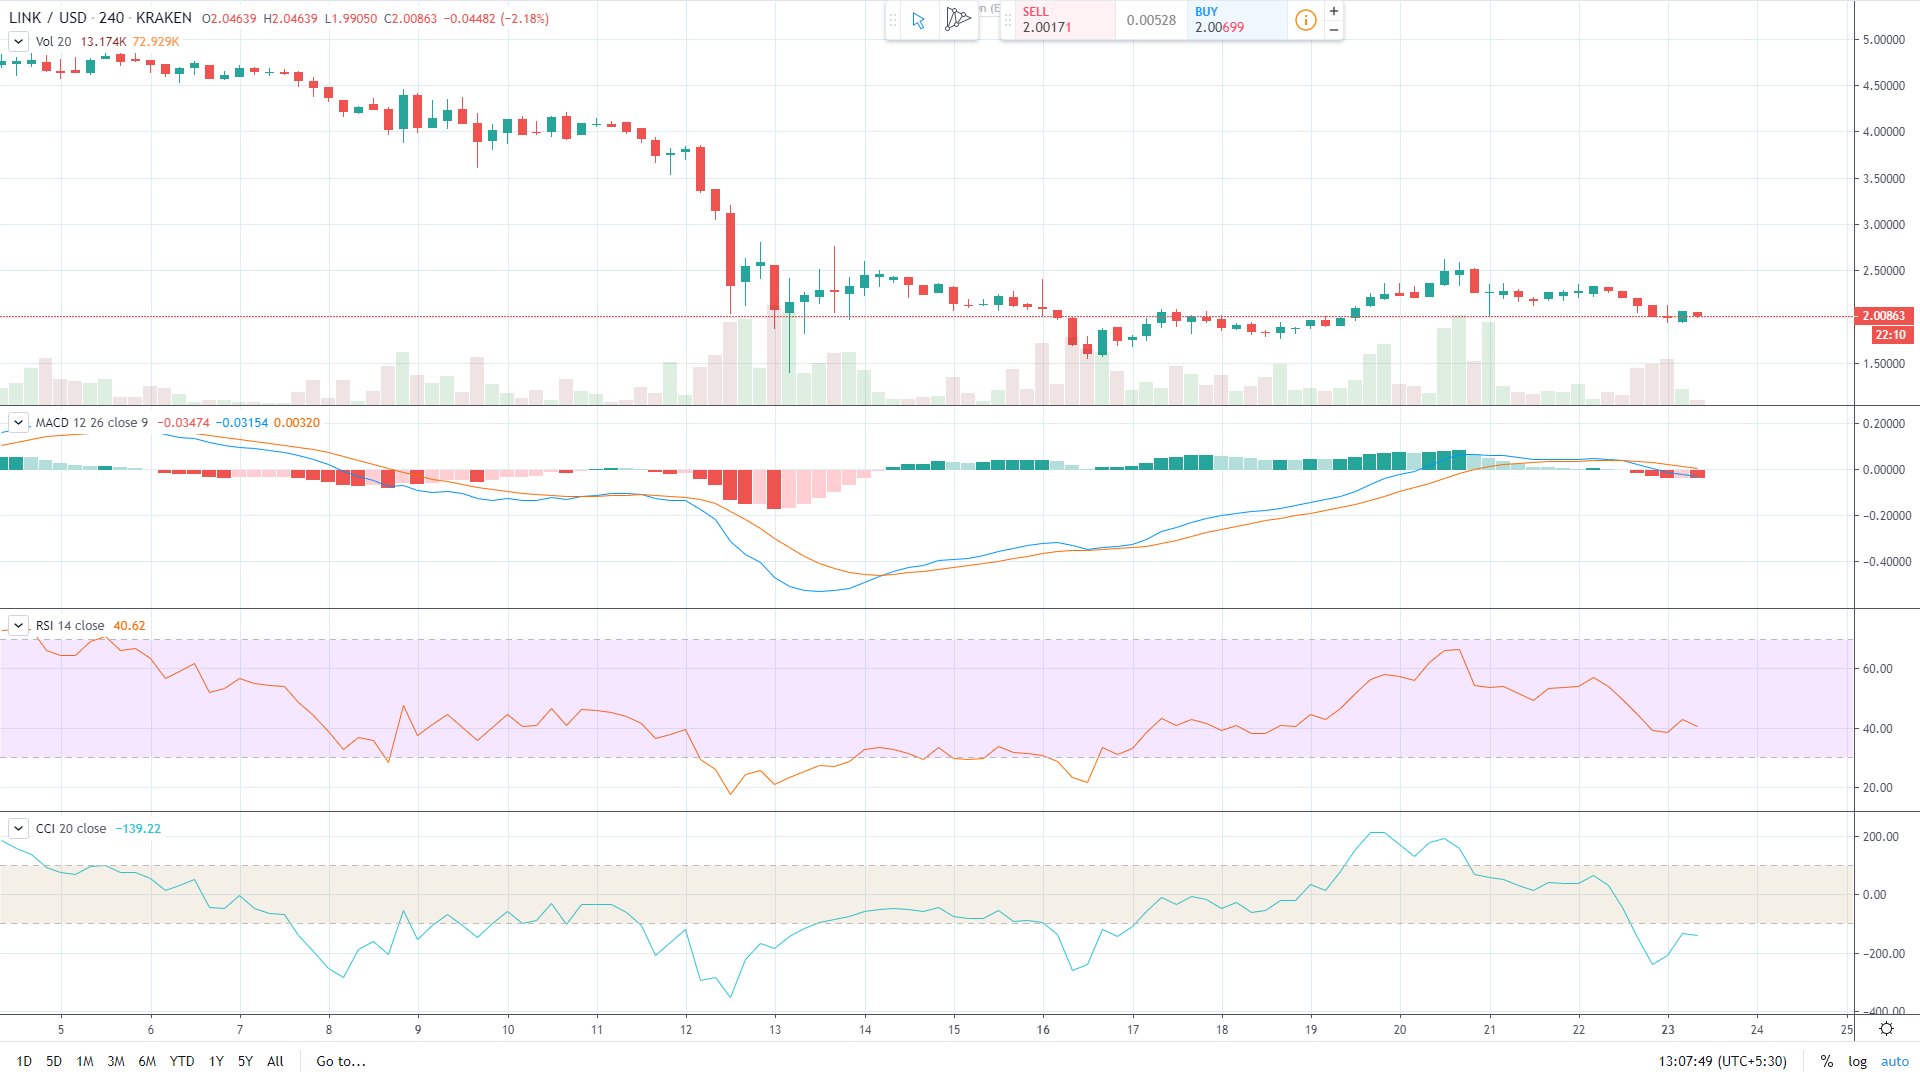
The technical graph reflects the heavy downtrend faced by chainlink which forced a huge drop from the price level of $4.00 to the level of $1.70.
The MACD levels are reaching a bearish zone which is a negative sign for the chainlink. This means that LINK bears are hitting more impact.
The 24hr- RSI is showing downtrend nature with the level of 40. Any further downfall below the level of 40 will invite bears into play again
The 24hr-CCI had a negative divergence from the overbought region and is unable to sustain it in the normal zone. It has reached the oversold region and the downtrending nature means that it is planning to stay in the region.
Resistance level: $2.50 and $2.70
Support level: $2.00 and $1.70
Mr. Pratik chadhokar is an Indian Forex, Cryptocurrencies and Financial Market Advisor and analyst with a background in IT and Financial market Strategist. He specialises in market strategies and technical analysis and has spent over a year as a financial markets contributor and observer. He possesses strong technical analytical skills and is well known for his entertaining and informative analysis of the Financial markets.


