
 Home
Home News
News
- ICON (ICX) is unable to maintain a sustainable rise in the prices and started falling continuously with bearish momentum.
- The ICX/BTC level is also performing negatively with the overall loss of -0.97% bringing the level to 0.00003050.
- ICX is showing signs that it is about to test its current crucial support level as prices adopted negative divergence
ICX bulls are unable to maintain their gradual climb as cryptocurrency is again prone to continuous downfall. After hitting the price level of $0.230 prices were unable to maintain their positive divergence and started collapsing

There is a strong resistance of 0.250 which is not allowing prices to make the further climb and also pushed them down to again test their support level.

This fall of the cryptocurrency is a very bad indication, that ICX prices are venerable against further climb and keep on falling downwards. Currently, prices are trading at the level of 0.2014 with significant downfall.
Currently, the market capitalization of ICON is at $107,307,148USD with the volume traded of $11,893,892USD with the market circulating supply of 530,385,983 ICX.
ICON (ICX) Price Analysis
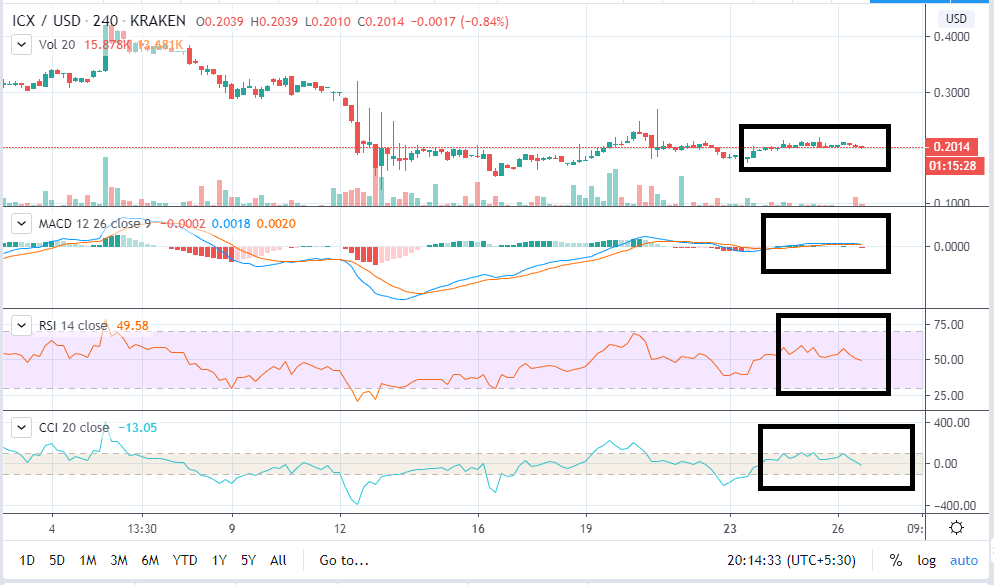
The technical chart indicates the prices are unable to maintain their climb as unable to stand against the heavy resistance, bulls are also not giving up as there is also an increase in the prices developing a flat trend method.
The technical indicators and oscillators are showing an increase in the selling volume of the ICON as crypto traders are concerned about the ICON’s future.
The MACD level again adopted the bearish momentum and both buying and selling volume are at the same level, there might be chances that could be a positive trade but currently, bulls are dominating.
RSI took a negative divergence and touched the crucial level of 50 and then started trading on it with the tendency to fall further below.
Resistance Level: $0.250 and $ 0.240
Support Level: $0.190


