
 Home
Home News
News

- BNB acquired sharp negative divergence showing signs that it is coming short against the bears.
- Prices have torn apart many support levels while falling, including crucial levels of $13.50 and $12.50
- The BNB/BTC pair is performing negatively with the overall loss of -0.27% bringing the level 0.00194041.
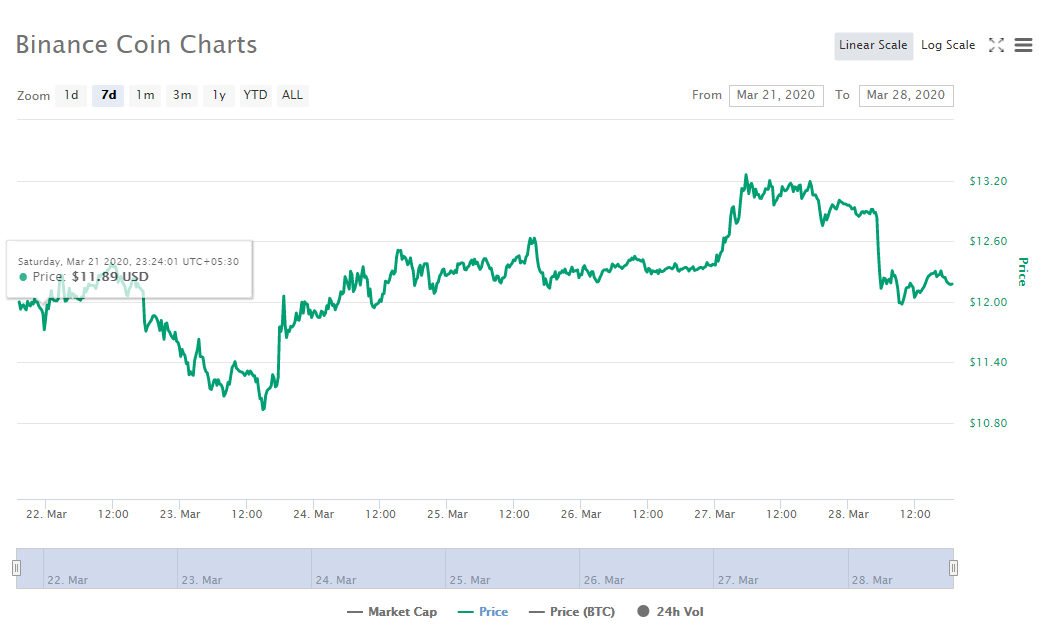

The 7-day weekly chart indicates that there is a major downfall in the prices and they are unable to maintain a gradual climb to recover today’s loss.

The BNB price level of $12.00 is being a key support level which puts a halt on today’s significant price fall. BNB needs to develop a positive divergence as soon as possible but currently if they were not able to maintain a gradual climb with the help of $12.00 they won’t be able to maintain a gradual rise against the current crucial resistance level.
BNB‘s current market capitalization is $1,887,346,831 USD with volume traded of $ 235,569,729 USD and circulative supply of 155,536,713 BNB.
Binance Coin Price Analysis
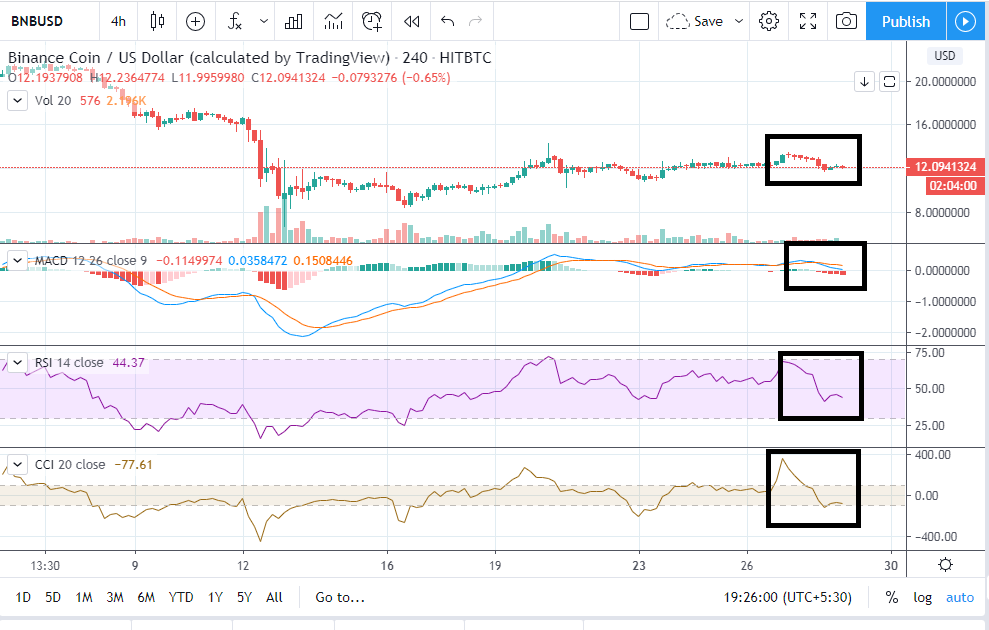
The technical chart indicates that prices are suffering a complete downfall due to the market odds. Prices are about to lose the level of $12.00 again, prices are unable to maintain a gradual climb and now there is a major bearish movement.
The technical indicators and oscillators are showing an increase in the selling volume of the cryptocurrency. This might be a very bad sign for crypto traders.
MACD levels are showing that selling volume is getting ahead of the buying volume and now prices are exposed to the market bears.
RSI takes a sharp negative divergence from the bullish region to the bearish region of the selling zone, indicating that there is an increase in the heavy increase in the selling volume of the altcoin and currently trading below the level of 50.
Same goes with the CCI level as prices are gradually falling, from the heights of the over buying region prices took a sharp negative divergence to the bottom of the normal zone and then started trading over there.
Resistance level: $12.20
Support level: $12.00


