
 Home
Home News
News

- Lumens price avoids the fall below the price level of $0.040 and indicates further bullish move.
- It must surge above $0.0.42 to have a safe spot and to build a bullish momentum in the market.
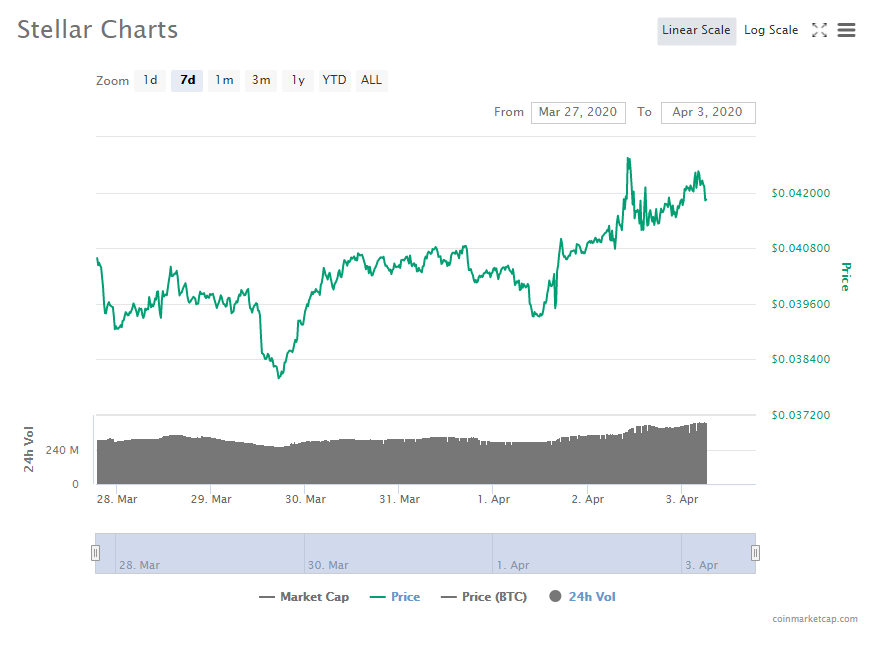
Stellar lumens are showing impactful price recovery signs from the starting of the month by crossing the crucial price level of $0.040. However, the resistance level of $0.043 came in between and dropped the altcoin to the vulnerable level of $0.040

Currently, the altcoin has managed to sustain above the price level of $0.040. If XLM manages to cross above the price level of $0.043, it will indicate that it is on the road of recovery. On the opposite side, if it breaks below the $0.040 price level, it will indicate that the bears can provide significant damage again this month.

Looking at the overall market conditions, XLM might able to cross the price level as the majority of the crypto assets are also taking the road for price recovery.
Recently, XLM bulls showed signs of existence by crossing a $0.040 mark a few days back. However, Currently, it is on bullish momentum and gaining around 2.87%. The current price is around $0.041 with the market capitalization of $851,436,334,696 and the 24H volume traded is $431,051,923.
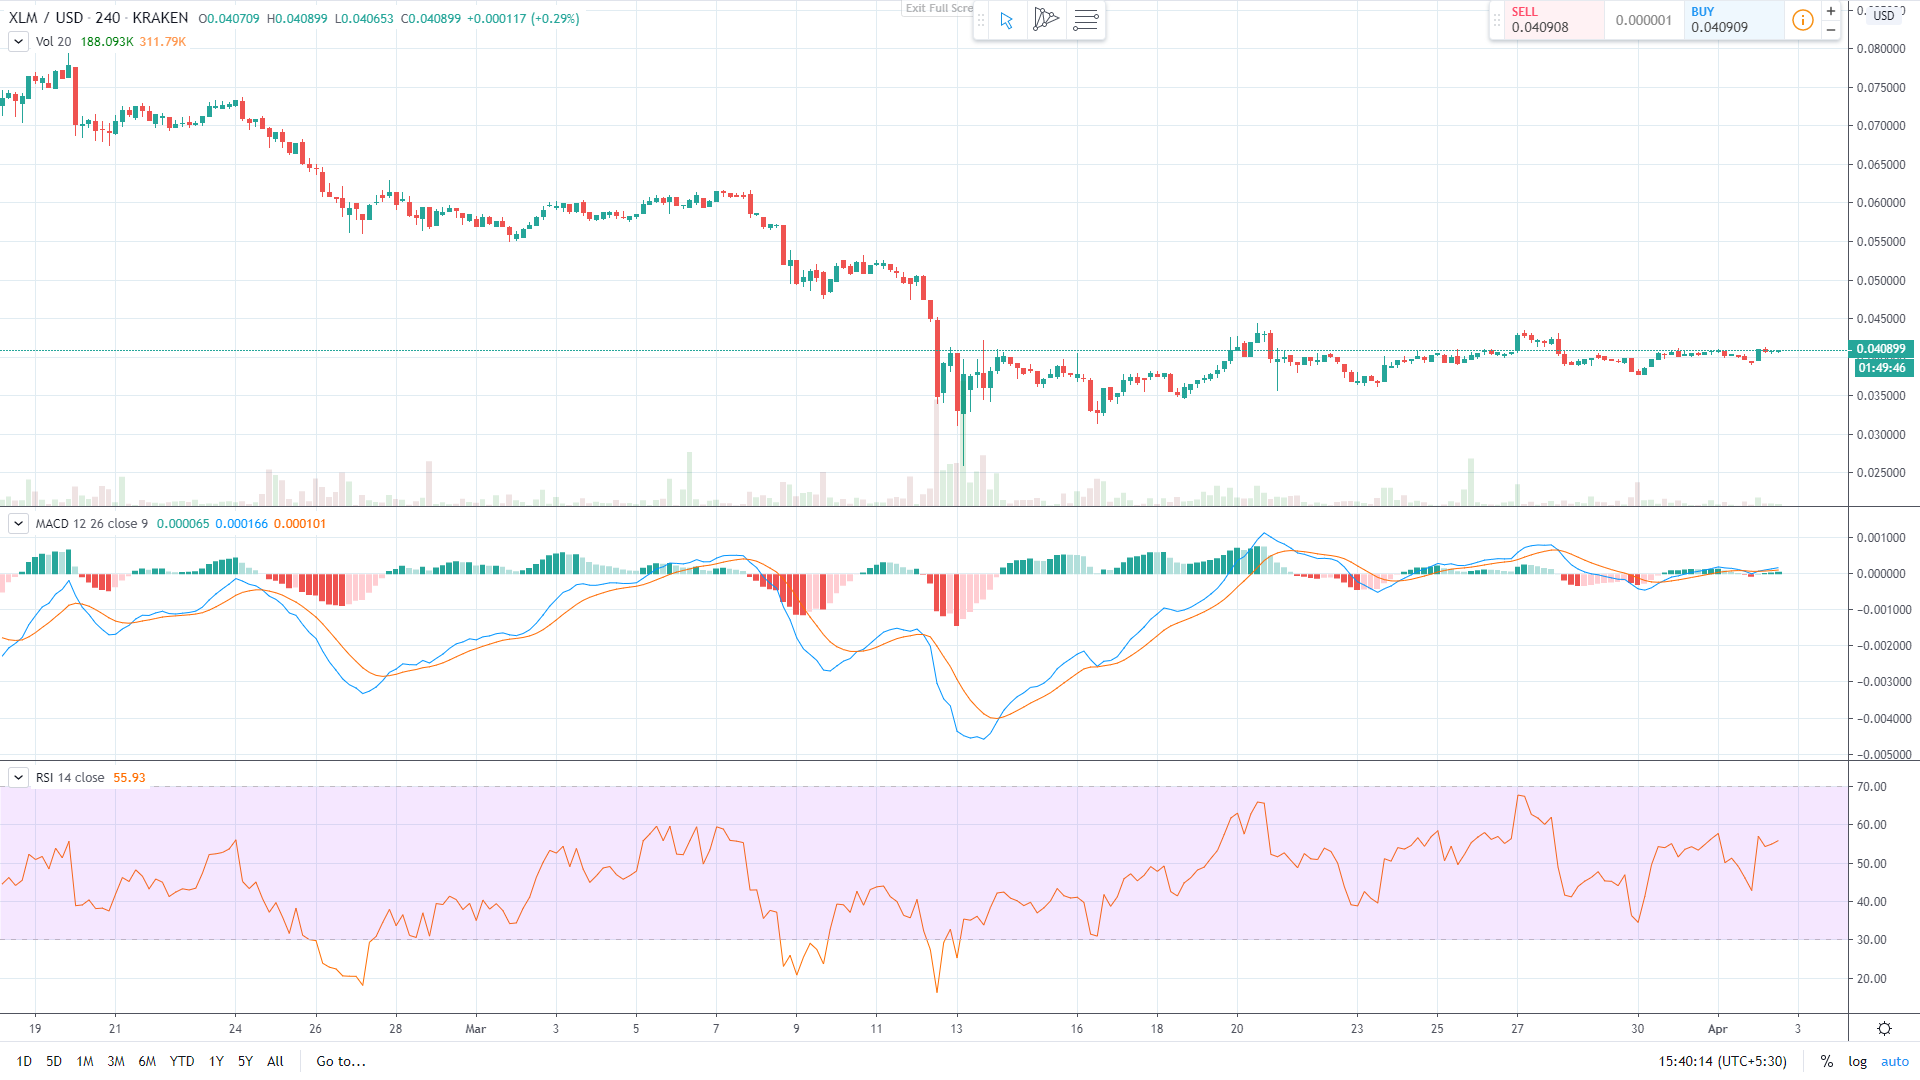
The technical charts reflect on the steady bullish movement of XLM which is followed by the sudden decline which is the result of attempting to cross a $0.40 area. We can also observe that the current price is on the support line which favors XLM bulls. Any downfall below $0.040 can result in a major downfall for the cryptoasset.
Fib retracement levels are looking sustainable at the level of 0.386. An upward break in the level will provide positive momentum to the altcoin.
The symmetric triangle is yet to be broken significantly. A positive or negative break will act likewise.
The RSI is reaching a bullish level of 60 which is a positive indication for XLM bulls.
CCI also had a negative divergence from the overbought region to the positive region now. Overall, the technical indicators favor a bullish movement from here.
Resistance Levels: $0.043 and $0.045
Support Levels: $0.040 and $0.038
Mr. Pratik chadhokar is an Indian Forex, Cryptocurrencies and Financial Market Advisor and analyst with a background in IT and Financial market Strategist. He specialises in market strategies and technical analysis and has spent over a year as a financial markets contributor and observer. He possesses strong technical analytical skills and is well known for his entertaining and informative analysis of the Financial markets.


