
 Home
Home News
News

- The blockchain-based distributed cryptocurrency platform Ethereum Classic (ETC) is showing an ascending movement for more than a month.
- Looking at the graph of March, the beginning of the moth showed a continuous downfall in the price of ETC till March 13.
- With the commencement of April, the currency was stable to its position and was swinging on the upside direction portraying a triangle in the above-mentioned chart.
The blockchain-based distributed cryptocurrency platform Ethereum Classic (ETC) is showing an ascending movement for more than a month. This is the period for the trades to invest in the coin as the technical indicators depict an affluent period in the future.

Ethereum Classic (ETC) Price Analysis
The ETC’s current momentum is striking. The price mark of $8 is the stable point for ETC and breaching it is quite impossible as investing in ETC is not useless. At the starting of 2020, the price of ETC was brood over $4.4. It was under bullish situation as it was noted a continual upside movement.

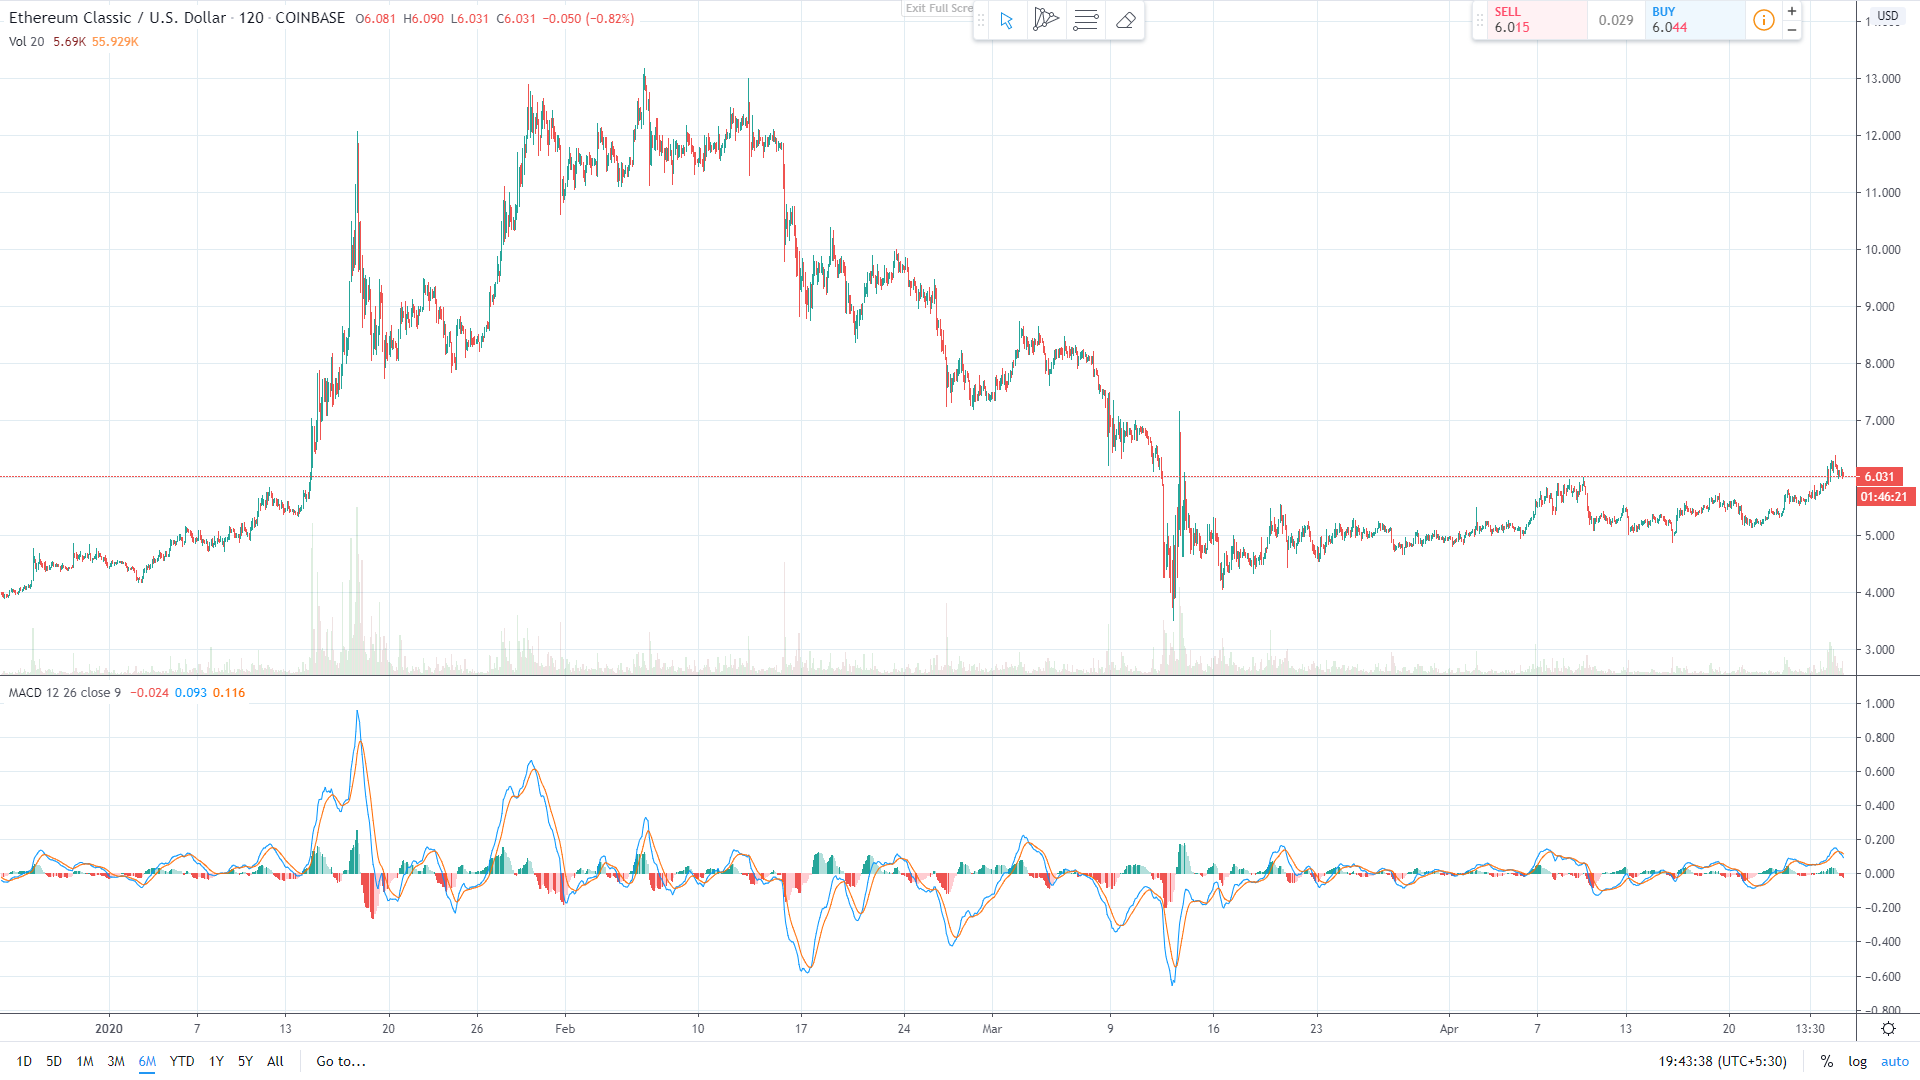
However, after the next 30 days of its trading, the price crossed to $11 and touched $11.47. With a slight decline at the end of January, it again came back to its position and traded to $13.4 within February first week. Meanwhile, ETC faced a downward decline and ended the month around $8.
Looking at the graph of March, the beginning of the moth showed a continuous downfall in the price of ETC till March 13. Moreover, after the second week, it started regaining upside momentum. The Ethereum Classic traded with a rise and registered a higher low pattern.
With the commencement of April, the currency was stable to its position and was swinging on the upside direction portraying a triangle in the above-mentioned chart.
Ethereum Classic (ETC) Technical Indicator
While looking at the MACD (Moving Average Convergence/Divergence) indicator, the histogram indicates bullish signs for ETC. The single line is trading below the MACD line showing a moderate gap between them.
Thus, if the price of ETC breaks the immediate resistance level at $8.2 then it can be assumed that the coin will trade around $10 in the near future. Though, at the time of writing this article, the price of ETC was $6.07.


