
 Home
Home News
News

- The bears are showing no mercy for ether price as it is reaching the crucial level of $200
- It is also facing a minor overall loss in today’s market of -1.00%.
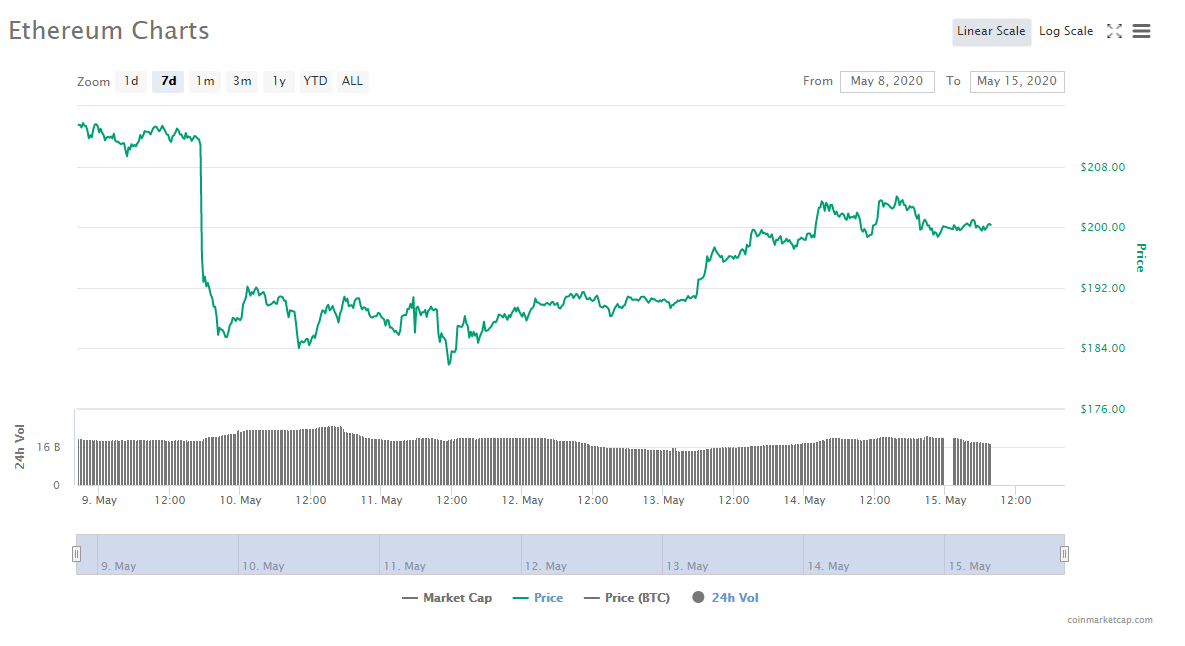
On the 7day-weekly chart, Ethereum ETH price started off by going above the crucial level of $210. The overall positive movement in the market indicated that it will be facing positive momentum in the market for a while. However, the overall market conditions had something else to offer and there are significant price corrections going in the market. This resulted in ETH breaking below the crucial level of $200 again.

Breaking below the $200 mark has opened up more vulnerability to the second-largest crypto asset in the world. The downtrend continued for Ethereum in today’s market also until it got to the major support level of $185.

Another fall below the price level of $200 has weakened the support level of $190.00 and the crypto asset may plunge more this time. However, after breaking below the price mark of $200.00, Ethereum can revive its buying volume which means the market can treat it as a buying opportunity.
Ethereum Price Analysis
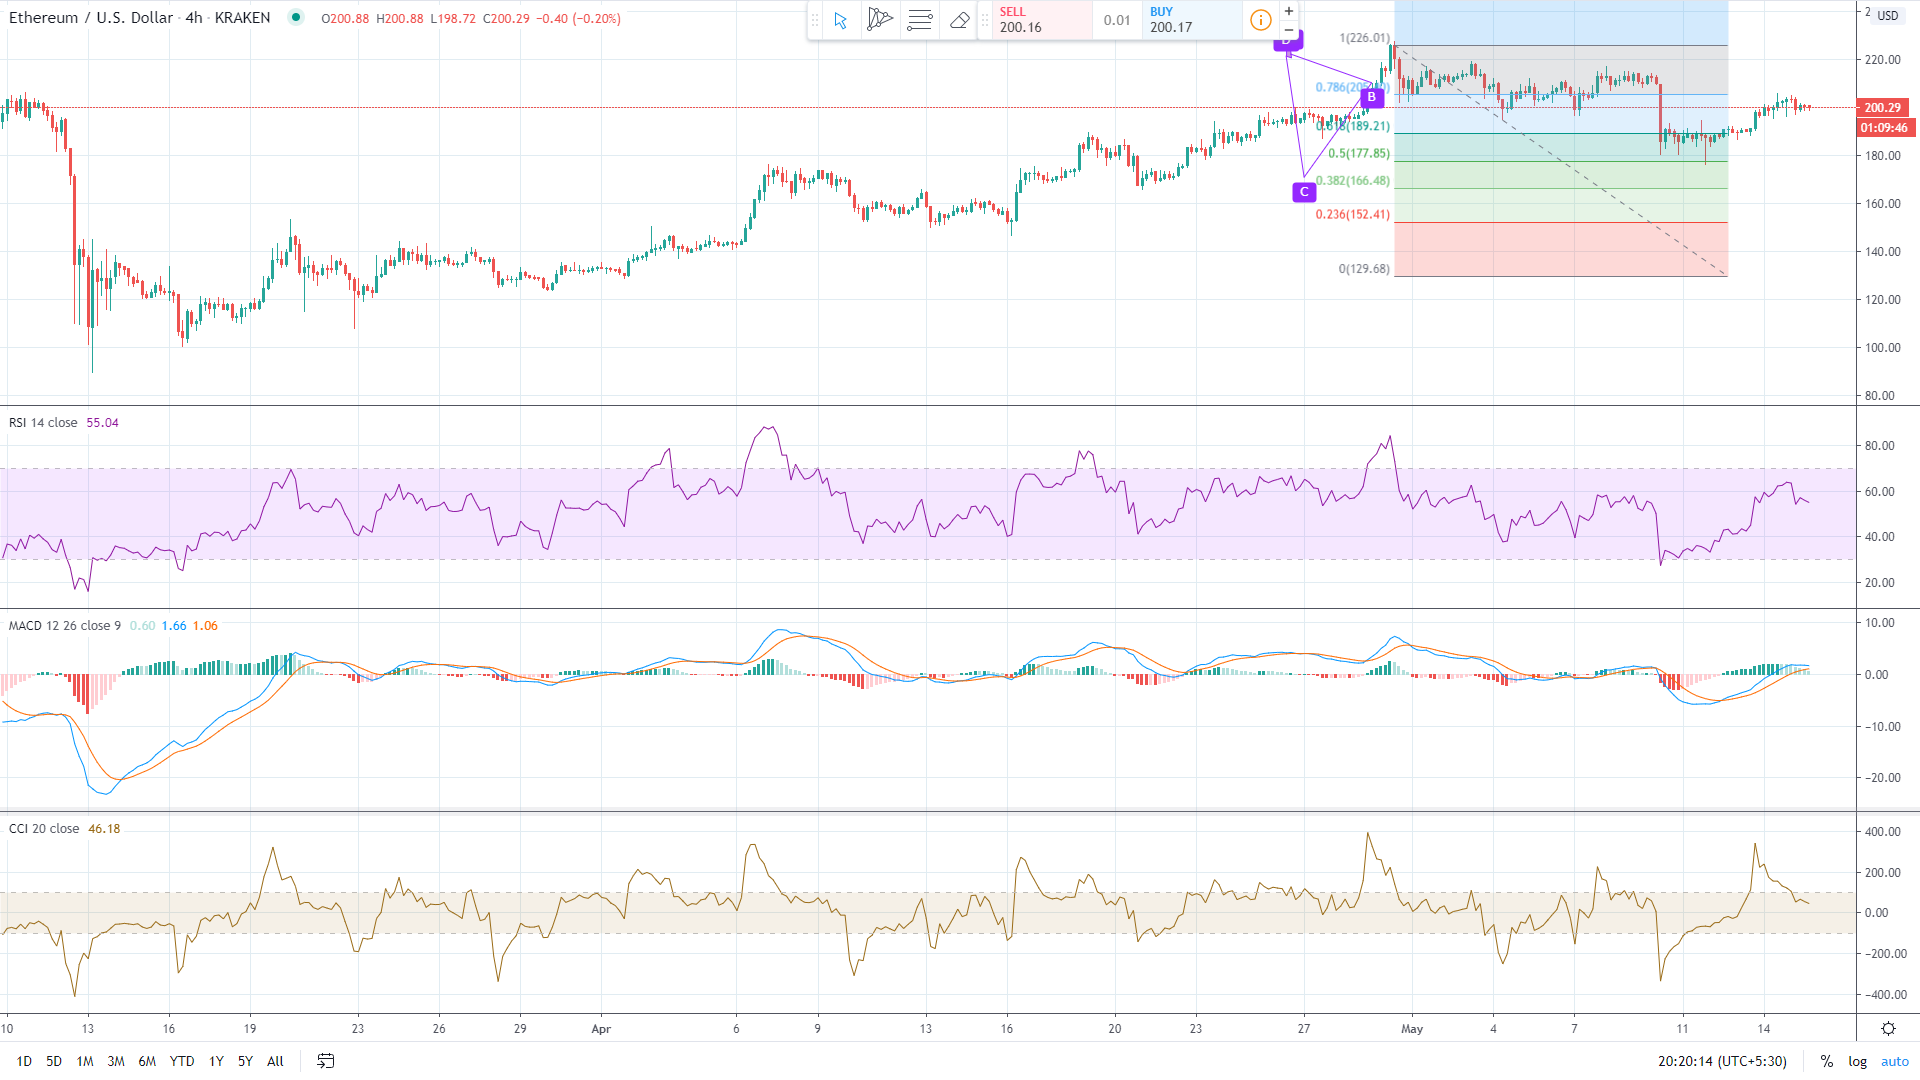
Ethereum price analysis using a technical chart indicates that the level of $190 can be a good buying opportunity for Ethereum investors. Also, the fib retracement level is below 0.786 which indicates that ether might be able to sustain on the support level of $200. The levels also indicate that any further downfall can bring the price levels to $170 mark also.
The MACD levels also show that ethereum is getting significant selling volume after breaking below the price level of $200. The buying volume also attempted to make a bullish cross but was unsuccessful. This has indicated that ETH is not incapable of starting a positive movement in the market
The 24hr-RSI also avoided a negative divergence to the oversold region by reaching the mid area of the normal territory for Ethereum. The positive divergence might help RSI to reach the level of 40.
The 24hr-CCI has been extremely volatile for the past few days. After touching the peak of the overbought region, it had a negative divergence to the oversold region. However, it is still showing positive nature in the normal region
Resistance level: $205
Support level: $200 and $189
Mr. Pratik chadhokar is an Indian Forex, Cryptocurrencies and Financial Market Advisor and analyst with a background in IT and Financial market Strategist. He specialises in market strategies and technical analysis and has spent over a year as a financial markets contributor and observer. He possesses strong technical analytical skills and is well known for his entertaining and informative analysis of the Financial markets.


