
 Home
Home News
News

- Nano (NANO) started the year with some positive momentum on the charts.
- Nano’s run from June to August has been great, mainly in terms of its price increase.
- The cryptocurrency went from being valued at less than $0.35 in March to being exceeded at $1.48.
Nano (NANO) started the year with some positive momentum on the charts. In February, the coin attained substantial gains; the coin surged as high as $1.13. However, Nano’s surge lost steam with the NANO price falling back to $0.6 level. On March 12th, the cryptocurrency markets abruptly dropped, the price of bitcoin slid from $7939 to $4346, marking a sharp drop of 45%. Following the correlation with bitcoin, the Nano price slipped from $0.6 to $0.3. March 12th, 2020 so-called ‘Black Thursday’ is tortuously engraved into the minds of traders and HOLDers alike. The Defi Boom contributed a lot to the crypto market’s recovery from the March crash.

Price Action
Nano’s run from June to August has been great, mainly in terms of its price increase. The cryptocurrency went from being valued at less than $0.35 in March to being exceeded at $1.48. This exponential rise arrived at a time when bitcoin broke a psychological barrier of $12000. In part, following bitcoin’s dominance has to be the cause for most altcoins to rally.

The first Quarter of 2020 has been exceptional for Nano (NANO), crypto-asset recorded year-to-date gains of +78.9%, the recent climb boosted the token to current high at around $1.44. The third quarter of 2020 brought significant improvements in the cryptocurrency market; however, sustainability becomes the primary concern.
With 6.76% price loss over the last 24-hours, NANO is currently trading at around $1.24. The key support levels at the downward range are $1.11, $1, and $0.7 to reach the channel’s support line. It is observed that the chart’s volume reveals a substantially low amount of liquidity. In contrast, we can anticipate a trend reversal for the crypto asset trading with a possible price breakout to $1.4, $1.5 and $1.6 resistances.
Nano (NANO) Price Analysis

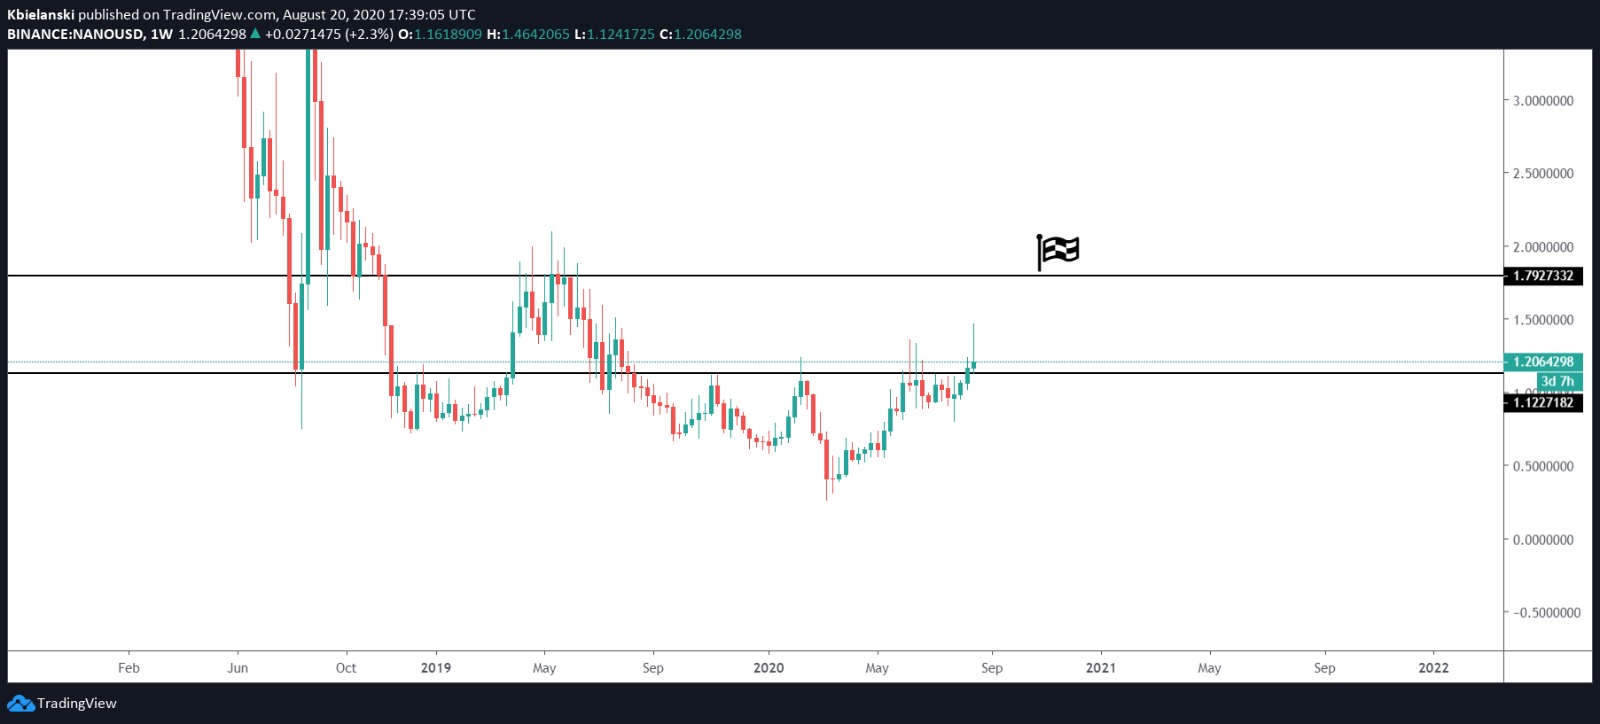
Looking into the monthly charts, the token have Adam and Eve pattern on the cards once price reaches first target, that took shape over the past few months.
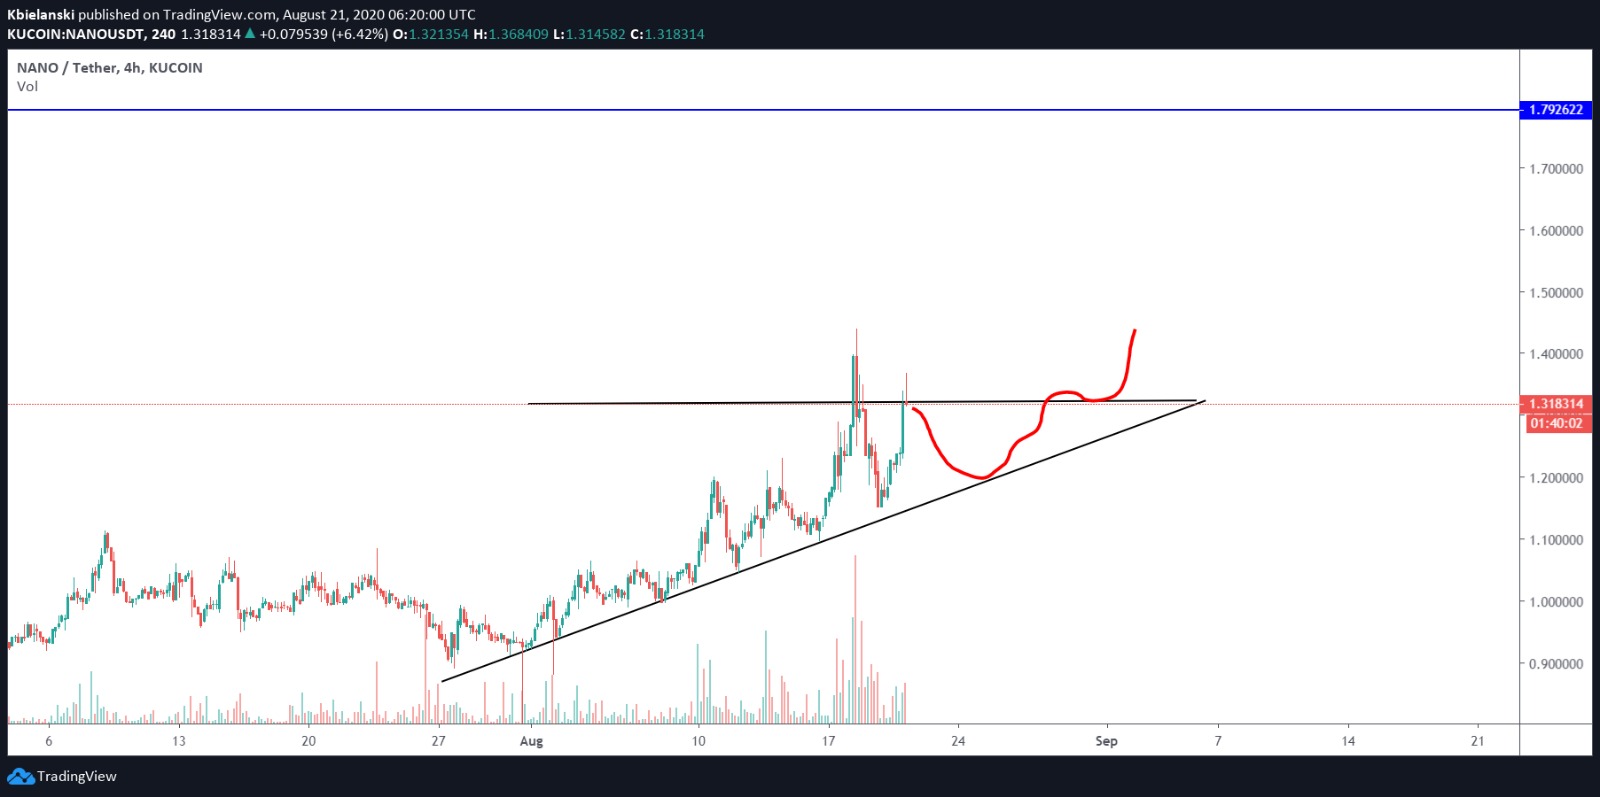
The four-hour price chart for NANO formed an ascending triangle where one of the trend lines forming a horizontal line, while the other trend line constructed higher lows with resistance. The pattern formed in the chart indicates an upward breakout in the coming weeks.
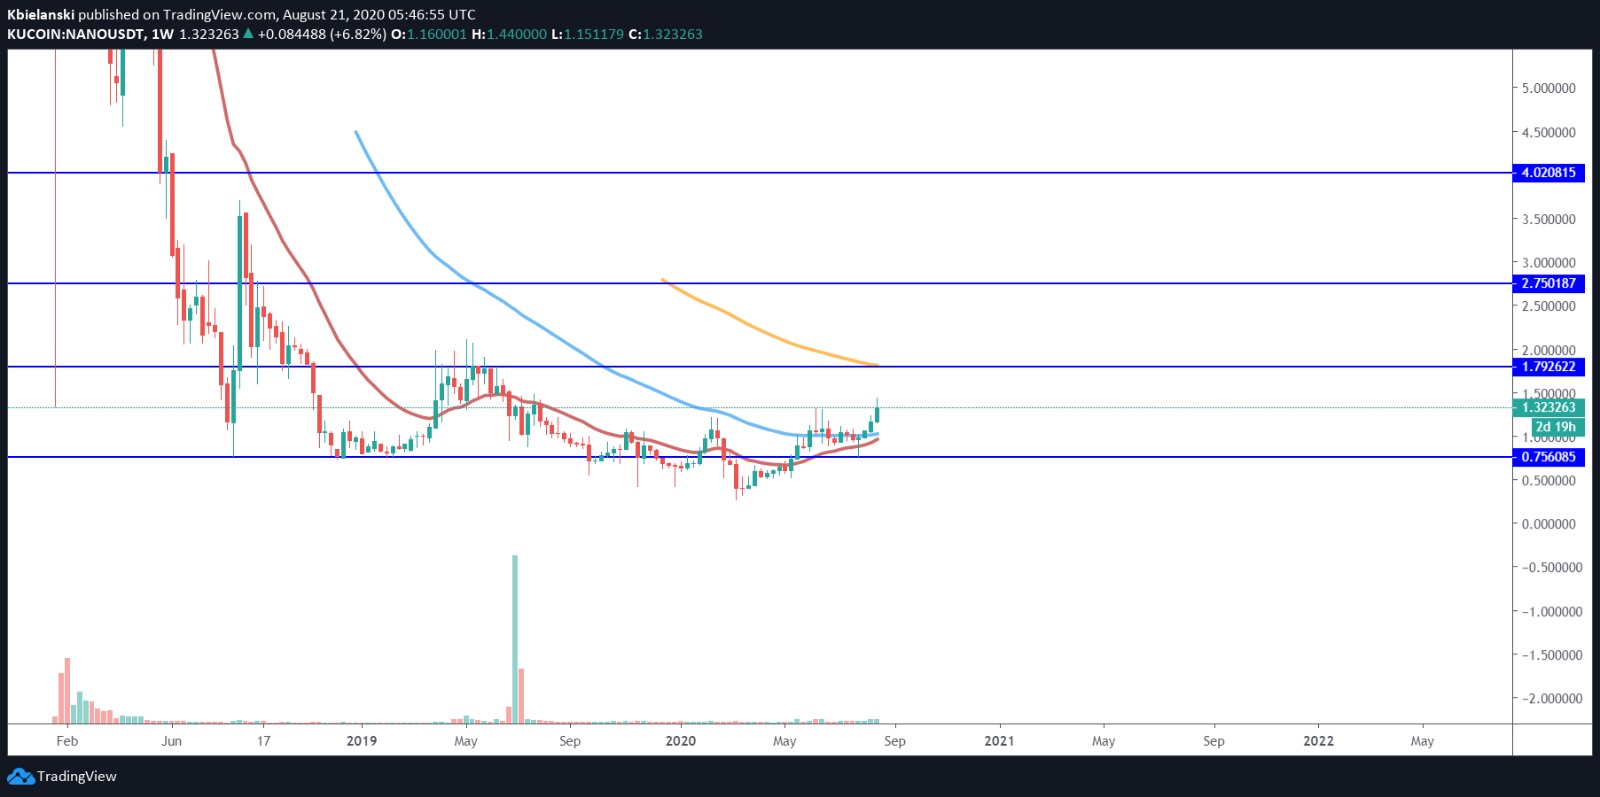
Nano’s short-term 20-period exponential moving average is edging closer toward the longer-term 50-period exponential moving average on the weekly chart, indicating a bullish crossover.
The RSI is observed at 67 points, to continue the bullish move nano needs stay close to $1.80 next month and this will complete Adam and Eve pattern. According to the pattern on the charts, we could expect further continuation to 3.15.


