
 Home
Home News
News

- The market dominance of bitcoin peaked at a multi-year high of 72.5% in October 2019
- Bear market is already over for alts, since march this year the lowest point was 36.89B dollars and since then altcoins managed to get to 155 billion dollars
- The monthly chart (macd) is already showing three green bars and confirms that we have entered the bull market
The dominance of the world’s leading cryptocurrency is being questioned as investors and traders move their wealth toward more lucrative ventures in Altcoin and DeFi projects. Altcoins have been getting some serious market traction over the past few months, thanks to the DeFiBoom.

The market dominance of bitcoin peaked at a multi-year high of 72.5% in October 2019. However, the peak was short-lived as altcoins started gaining momentum in the market, resulting in a sharp fall in bitcoin’s market dominance. Bitcoin’s dominance reached 61.92% during the Mid-march crash. Bitcoin suffered the worst sell-off in 7 years. Bitcoin lost almost 50% of its market value, other altcoins recorded minor losses compared to bitcoin. Then comes the Defi trend, which not only triggered the bullish sentiment in the market but also brings the alt season back. Following the DeFi boom, many mid-cap and low-cap altcoins saw their price surge independent of bitcoin. Bitcoin’s (BTC) dominance ratio has slid to 56.5% on September 14, 2020, the lowest dominance ratio in over a year.

Altcoin Market Analysis

Total2 is a reflection of the altcoins market and one of the best indicators to use when you want to trade them. Bitcoin is always viewed as a king or compared to gold but most people like to trade different coins due to their price and future potential.
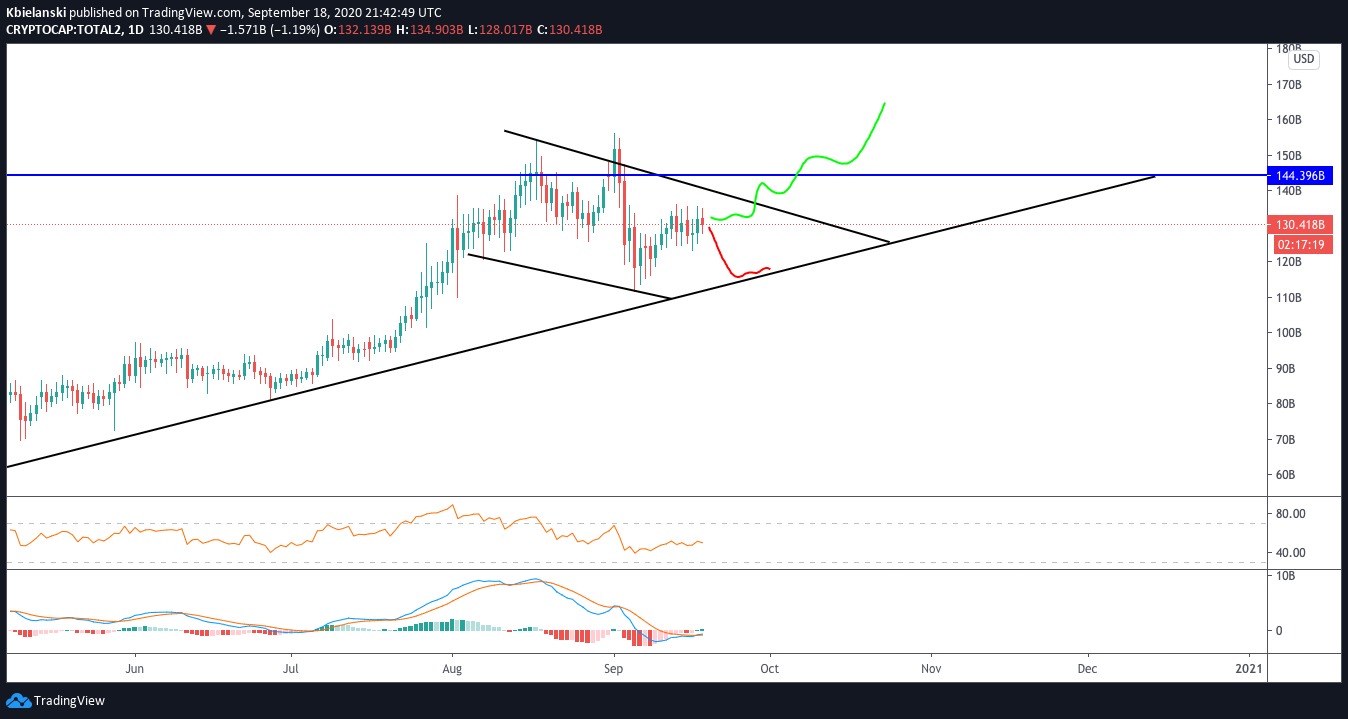
Bear market is already over for alts, since march this year the lowest point was 36.89B dollars and since then altcoins managed to get to 155 billion dollars, right now the market is retracing as most altcoins suffer. On the daily chart we can see two possible scenarios, one where we could retrace further to the long term support line or trade around a similar level and consolidate for a bit longer and finally break horizontal resistance.

On the daily time frame, we also formed a bullish flag. For now it’s best to wait for more data and see if it can break out from it. This year we will definitely see if the market is going to increase based on the data and support level we should breakout from this pattern by the end of november. If we do breakout then the next level is 250 billion, it would be another alt season for a few weeks.


The monthly chart (macd) is already showing three green bars and confirms that we have entered the bull market. At the moment everything is slow but from next year onwards we should experience a much bigger market and lots of growth. If you look at the cheat sheet and compare it with Total2 (without any indicators and drawing) we are right now in a disbelief phase.

In the future Total2 will be trading above the previous all time high and there are two levels based on the fibonacci tool. 1.618 which is 745b and 2.618 level which would be 1187b.

We are likely to get to the first level but for the second level it would require lots of retail investors.

However just like in 2017 we couldn’t predict bitcoin at 20k we could expect similar conditions but with better infrastructure to invest so this scenario is still possible.


