
 Home
Home News
News

- The monthly range is from $17.7 to $7.5 as high and low respectively of the crypto asset.
- It again bounced back from the level of $7.5 and now trading around $11.00.
- The level of $11.00 is resistance and touched multiple times over the weekly chart.
The market cap is around $3,711,876,572 and 24-Hours volume is rose by 7.31% bringing the level to $1,419,101,848. It has been one of the most volatile altcoins throughout the past several days, with its buyers and sellers both are active for control over its near-term trend.

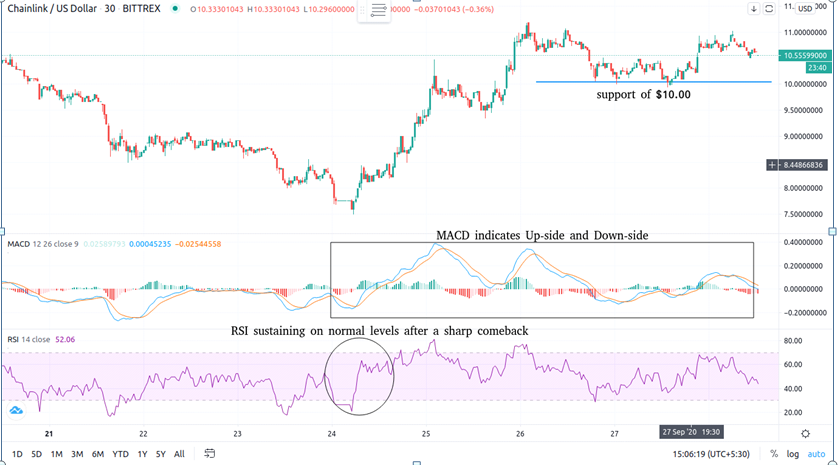
On the weekly chart, the chainlink showed huge volatility as it tested the level of $7.5 on the downside and sustain above the level of $10.50.
Relative strength index (RSI) made a sharp comeback in the levels which also helped the price to surge. However, the levels have shown signs of volatility since then. It came back from the overbought region twice and nearly avoided a drop to the oversold region. The current level is at 44.05
MACD gave a bullish crossover around the neutral zone which indicates an upside. However, the levels also gave a negative crossover in the same interval giving a sign of precaution to the investors.
The cryptoasset’s near-term trends may depend on Bitcoin, as the benchmark cryptocurrency has been guiding which direction altcoins like LINK will be moving ahead.
Mr. Pratik chadhokar is an Indian Forex, Cryptocurrencies and Financial Market Advisor and analyst with a background in IT and Financial market Strategist. He specialises in market strategies and technical analysis and has spent over a year as a financial markets contributor and observer. He possesses strong technical analytical skills and is well known for his entertaining and informative analysis of the Financial markets.


