
 Home
Home News
News

- Crypto king forms a symmetric wedge pattern over the level of $10,619 getting ready for a big move in the market
- As due to better global sentiments the BTC making it’s rising higher lows over the chart completing the pattern
- The Bitcoin dominance at 58.7% as BCH and BSV turns into green
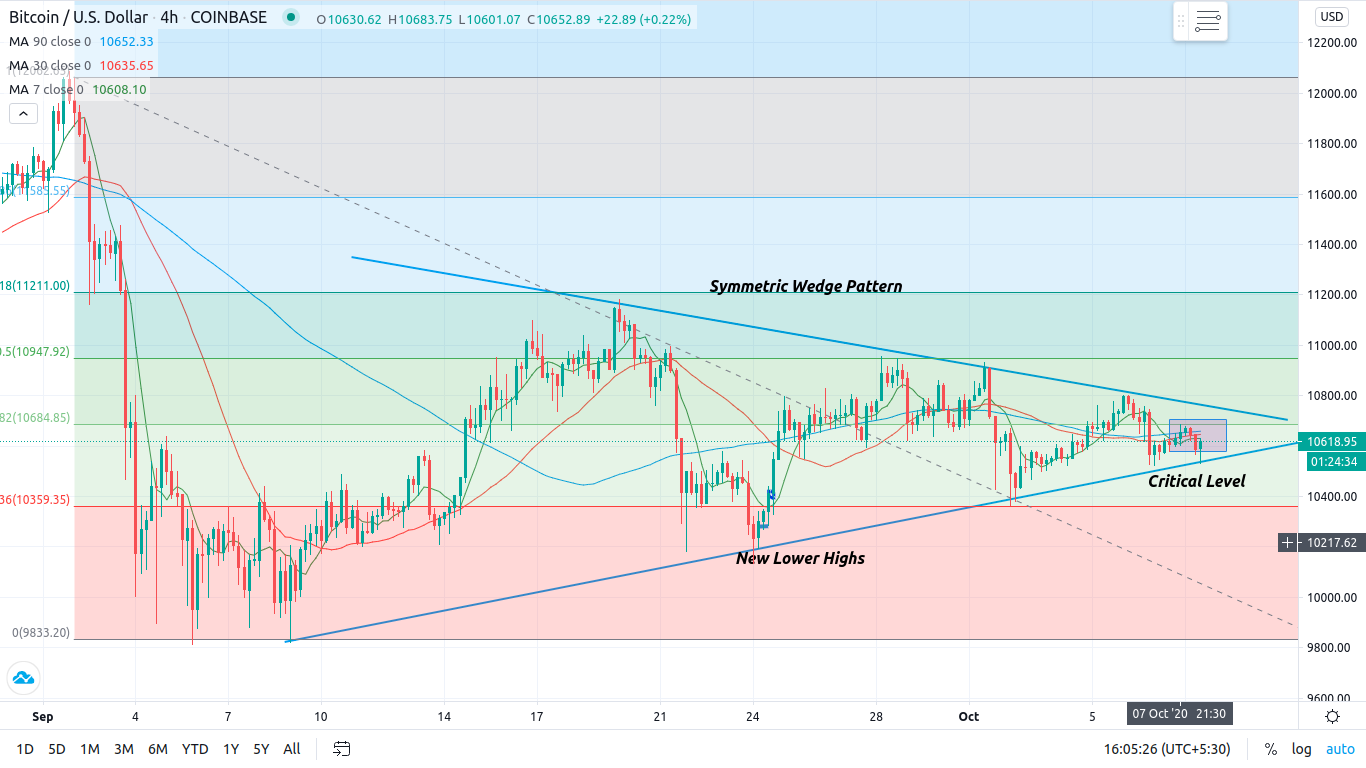
Over the 4-hours candle chart, bitcoin forms a symmetric wedge pattern ready for the next big move its 9-days, 30-days, and 90-days moving average supporting the pattern formed over the chart the crossover can give a big move in the price of BTC. Due to better global sentiment, the price of the token gets to recover from its monthly low of $10,528.89.

The overall crypto market was trading dull for the past two months as the price of BTC has been sustaining between the $10,200-$11,000 range. In recent days, the range has been narrowed even further, leading some traders to forecast a breakout.

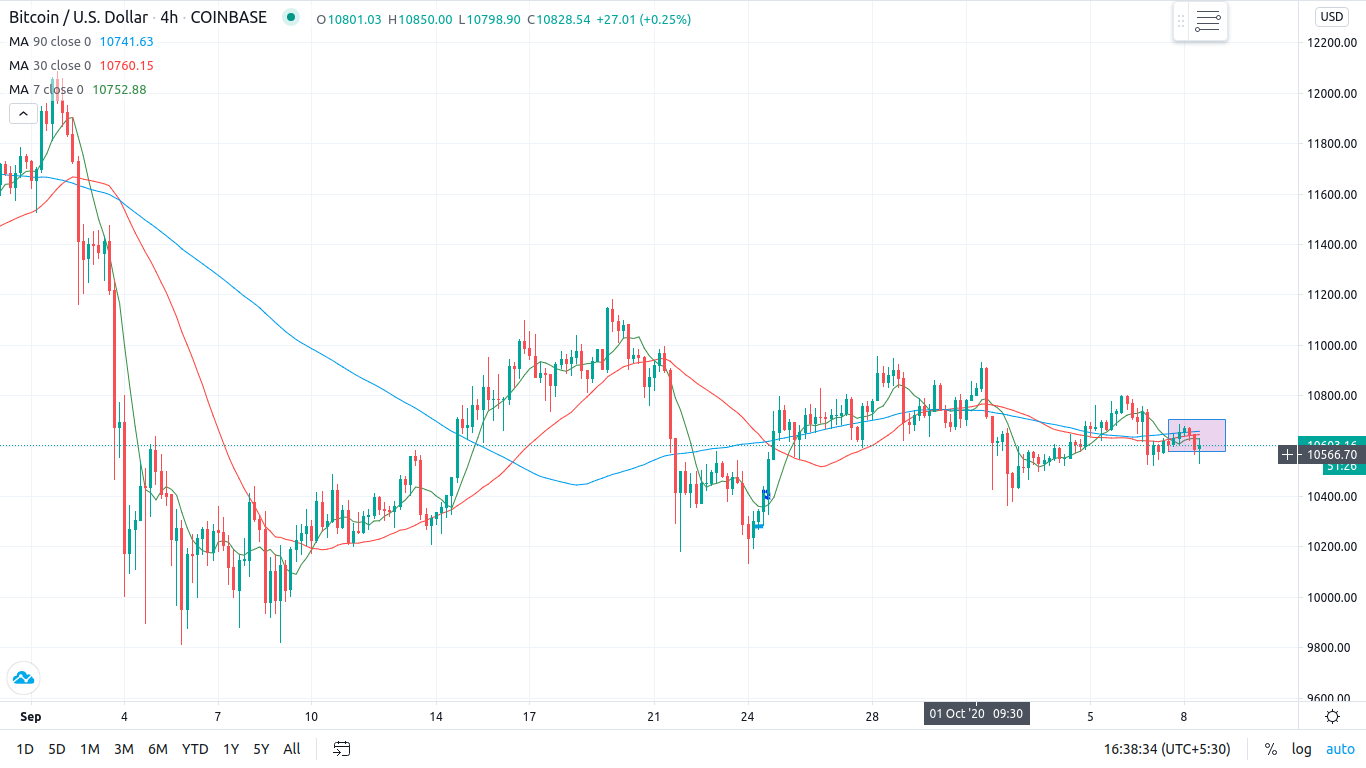
The moving average of 9,30,90-days is in the critical area as waiting for the golden crossover of the market king; we can see an upside from this region and the coin regain the level of $10,600 the performance of the token is slowly becoming relatable to the global market sentiments.
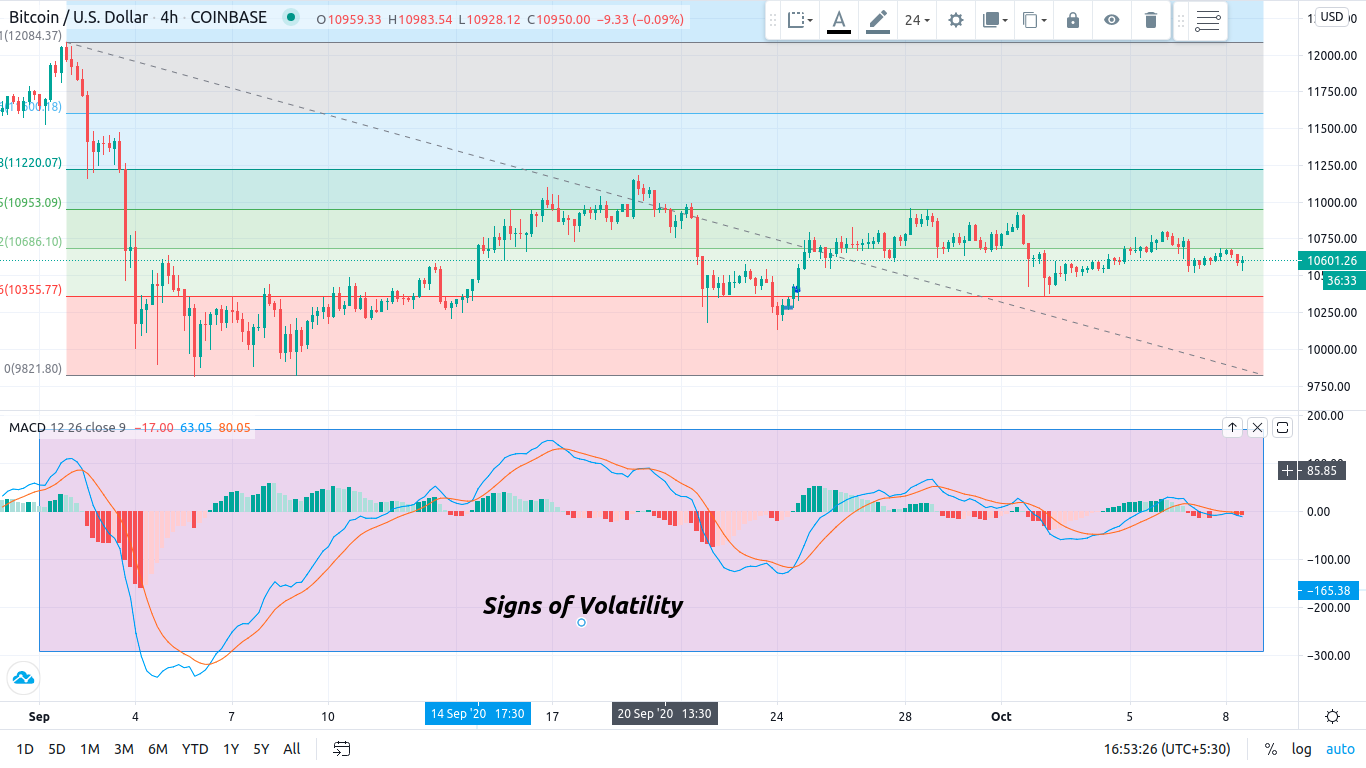
MACD supports the symmetric wedge pattern as the signs of volatility for the crypto asset the crossovers over the chart of the indicator are making higher lows and lower highs supporting the pattern for an up move in the token.
The resistance level for BTC is- $10,686 and $10,950.
Likewise, the support for it is -$10,355.
Join The Coin Republic’s Telegram Channel for more information related to CRYPTOCURRENCY NEWS and predication.
Mr. Pratik chadhokar is an Indian Forex, Cryptocurrencies and Financial Market Advisor and analyst with a background in IT and Financial market Strategist. He specialises in market strategies and technical analysis and has spent over a year as a financial markets contributor and observer. He possesses strong technical analytical skills and is well known for his entertaining and informative analysis of the Financial markets.


