
 Home
Home News
News

- After testing the major resistance level of $3.80, OMG Network faced strong retracement and looking to touch the support level of $3.20 on the downside
- The retracement has caused the OMG/LINK pair to turn negative facing significant loss of -11.05% bringing the current level down to 0.00018586 BTC
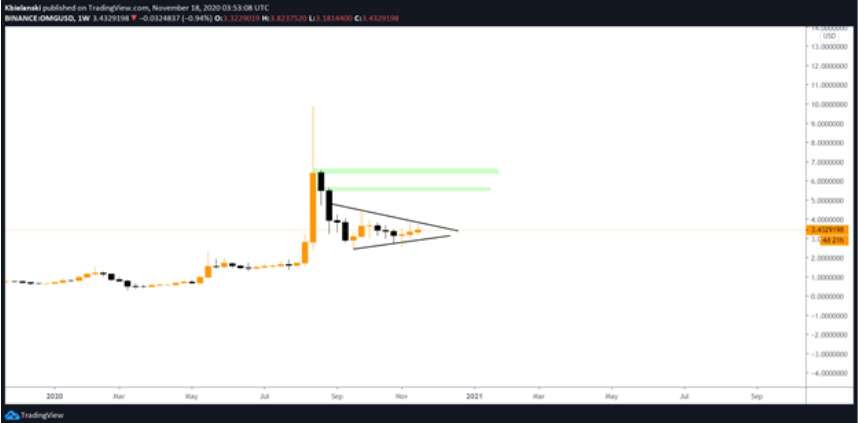
On the monthly chart, OMG Network had a decisive price recovery action after touching the critical support point at $ 2.50 on the downside. However, the crucial mark of $4.00 emerged as a new strong resistance mark for the price levels, which has formed an asymmetric triangular pattern. Since then, the price movement of the coin has been within the pattern and getting consolidated as the movement area gets vacuumed. It also presents a potential scenario of a breakout point which can be the deciding factor for the price behaviour of OMG in upcoming trading sessions.

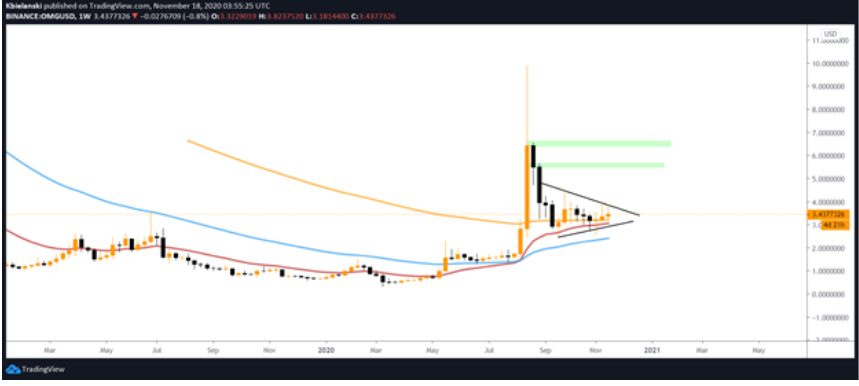
On the moving averages, EMA-20 has given a positive crossover against EMA-50 and moving well above EMA-100, reflecting on the sustained positive sentiment for the crypto asset in the market. However, due to the current price correction activity, EMA-20 looks vulnerable for a negative crossover too. If the price levels can provide a bounce back from the arriving support level of $3.20, EMA-20 could be acting as the support line with positive nature.


The current price candles are looking more bent towards upper circuits and showing potential for a positive breakout from here. The positive breakout will provide a break above the significant resistance mark of $4.00 and after that can look to gain bullish sustainable levels around $5.60 and $6.50, respectively.

The moving average convergence & divergence (MACD) levels showcasing consolidation for the price levels but are expected to provide a significant bullish crossover in upcoming trading sessions.
The Stochastic RSI (Stoch RSI) is showcasing negative nature and falling back from the overbought region due to the current retracement. The support level of $3.20 should help the levels to plunge any further to the oversold territory.
Join The Coin Republic’s Telegram Channel for more information related to CRYPTOCURRENCY NEWS and predication.


