
 Home
Home News
News

- Bitcoin SV (BSV) is trapped in a symmetrical triangle pattern, trading with intraday gains of +3.47% at $182.95
- The pair of BSV/BTC trading in green at 0.00950471 BTC with an intraday gain of 1.51%
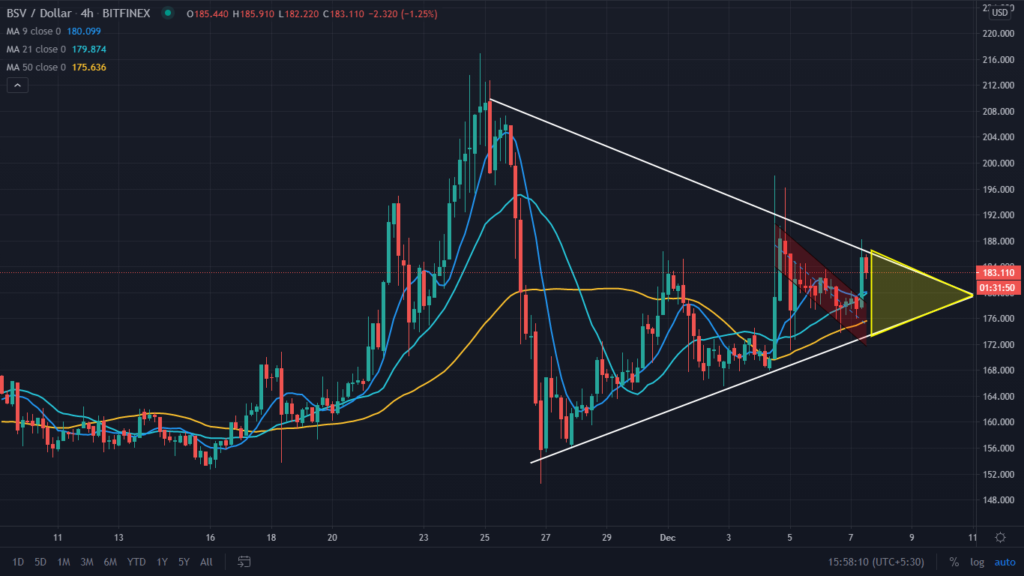
Bitcoin SV (BSV), after a bullish move it gets bounded between bulls and bears as forming the symmetrical triangle pattern. After the high of $216.65, the profit booking pulls the coin to the lower level of $151.76, while the price recovery pulls the coin upward but facing the resistance of the higher line of a symmetrical triangle pattern. While the 50-Day Moving Average acts as the support levels in the lower side. It is currently trading above the 9, 21, and 50-DMA, indicating positive momentum in it after the falling channel pattern a breakout is observed over the 4-Hours candlestick chart. Support on the lower side is placed at $165.88, and $151.75 will be considered strong support. On the upside, the resistance is at $195 and $216.65.

The investors are advised to wait for clear momentum after completing the pattern by keeping resistance and support in mind.

Over the daily chart, Bitcoin SV (BSV) is trading in the range of $174.28 and $187.34 lows and highs, respectively, and facing the resistance of the higher line of the Symmetrical triangle pattern. The coin is trading at 182.95 with an intraday gain of +3.47% volume traded in the last 24-Hours of $569,479,781, and the market capitalization stands at $3,399,294,130. For intraday, support is placed at $174.28, and resistance is at $195.89.
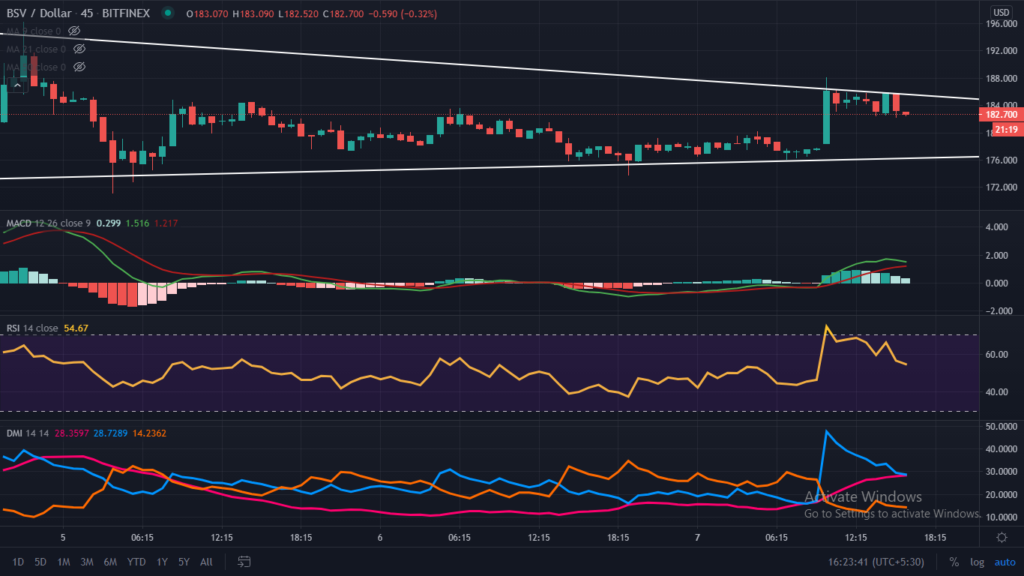
The Relative Strength Index (RSI) is trading at 54.39; after testing the overbought zone, it is now heading towards the oversold zone.
Directional Movement Index (DMI) is trading with the significance of +DI line over -DI, indicating the bullish movement with no sign of weakness.
Moving Average Convergence Divergence (MACD) after the positive crossover of Bull’s line (blue) over Bear’s line (red) with no sign of weakness but heading for negative crossover.
Support levels: $165.88 and $151.75
Resistance levels: $195 and $216.65
Join The Coin Republic’s Telegram Channel for more information related to CRYPTOCURRENCY NEWS and predication.
Mr. Pratik chadhokar is an Indian Forex, Cryptocurrencies and Financial Market Advisor and analyst with a background in IT and Financial market Strategist. He specialises in market strategies and technical analysis and has spent over a year as a financial markets contributor and observer. He possesses strong technical analytical skills and is well known for his entertaining and informative analysis of the Financial markets.


