
 Home
Home News
News

- Ethereum (ETH) dips to the price levels of $572.89 intraday as the profit booking is seen in the markets.
- The crypto king also trading near $18,800 with the dominance of 62.8%
- The pair of ETH/BTC is trading at 0.03061977 BTC with an intraday loss of -1.08%
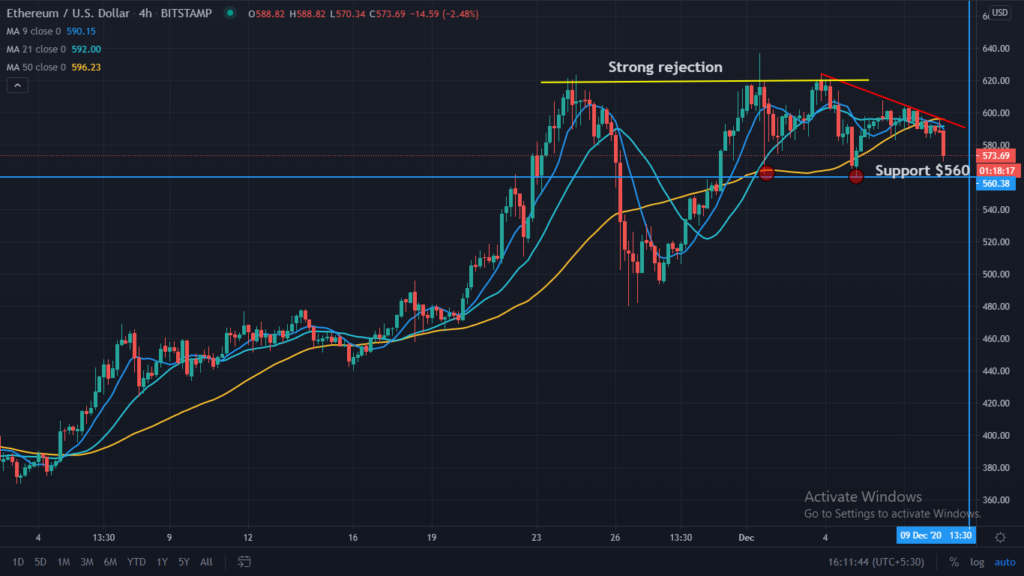
Ethereum (ETH) on the monthly chart indicates an uptrend as the whole market is in bullish momentum. However, on the higher side, it faces strong resistance at $620 and has tested multiple times but fails to clear it. While testing a level of $620 multiple times, it also hits a new 52-week high of 635.15 but fails to hold, and profit booking pulls it down to the levels of $485, but it bounces from these levels, and price recovery pulls it upwards. Some small dips are also observed to the $560, which can be considered the minor support for coming trading sessions. ETH at current levels is trading below the 9, 21, and 50- Day Moving Averages, which is the indication of a bearish trend for it, Whereas it is facing rejection from the upper sloping line. Resistance on the higher side is placed at $635, and long term resistance is $830. On the lower side, support is placed at $485 and the strong support at $370.

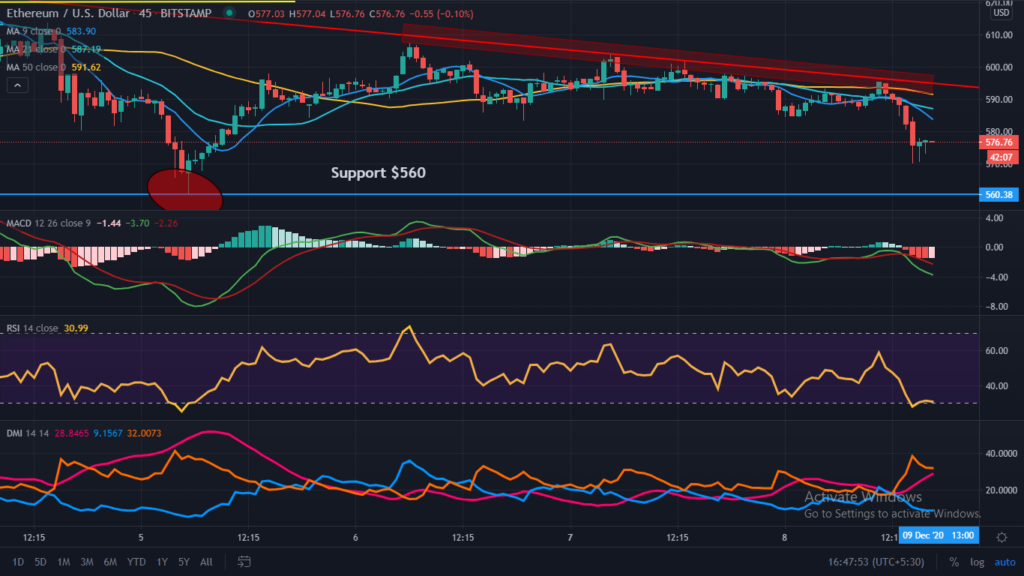
The daily chart of Ethereum (ETH) is trading in a downtrend and facing the upper trend line’s resistance and fails to sustain above the 9-Day moving averages line. Currently trading at the price level of $572.89 with intraday loss of -2.85%, supported by intraday volume is$11,976,665,245 and market capitalization stands at $65,680,705,489, in intraday it finds support at $560 and resistance at $600. So at current levels buying can be avoided but can buy at dips to the support levels.

The Relative Strength Index (RSI) which indicates ETH’s strength, is trading at 28.23 and still heading towards the oversold zone after a sharp fall from higher levels.
Directional Movement Index (DMI) is trading with a significance of -DI over +DI, indicating bearish momentum.
Moving Average Convergence Divergence (MACD) indicates the trend, and currently, it indicates the bearish trend on the intraday chart as gives a negative crossover with the significance of Bear’s line (red) over Bull’s line (blue) with no sign of recovery.
Resistance levels: $635
Support levels: $485 and $370
Join The Coin Republic’s Telegram Channel for more information related to CRYPTOCURRENCY NEWS and predication.
Mr. Pratik chadhokar is an Indian Forex, Cryptocurrencies and Financial Market Advisor and analyst with a background in IT and Financial market Strategist. He specialises in market strategies and technical analysis and has spent over a year as a financial markets contributor and observer. He possesses strong technical analytical skills and is well known for his entertaining and informative analysis of the Financial markets.


