
 Home
Home News
News

- XRP is trading with a loss of -2.20% and facing the strong resistance of the upper trend line and also bouncing from the lower support line
- The pair of XRP/BTC is trading at 0.00003148 BTC with intraday -1.62%
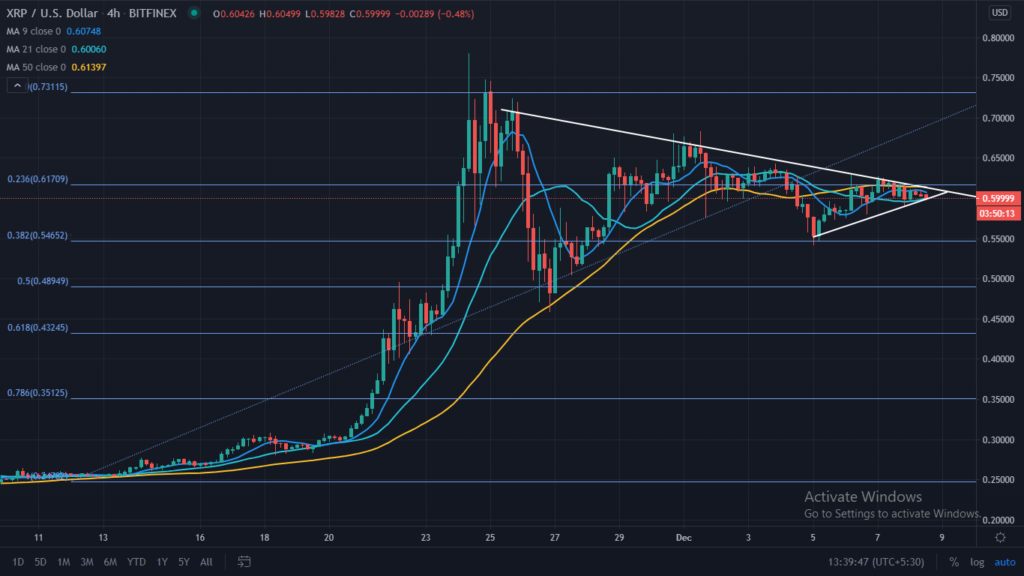
After a bullish movement, Ripple (XRP) is trading in the range of $0.7680 and $0.4600 act as highs and lows, respectively. From the level of $0.2460, sudden buying pulls to a higher level of $0.7680, and a profit booking pulls it to the level of $0.4600 can be considered as the support for the short term. At the same time, it is currently trading in a narrow range and forms the symmetrical triangle pattern from the last seven days. If XRP fails to give a positive breakout, then we can see lower targets of $0.5000 and $0.4700 on the downside, while on the higher side, if it breaks the trend line upward, then we can see upside till $0.7650. 50-Day Moving Average, which is the average moving price levels of the last 50-Day.

The investors are advised to wait for clear momentum after completing the pattern by keeping resistance and support in mind.

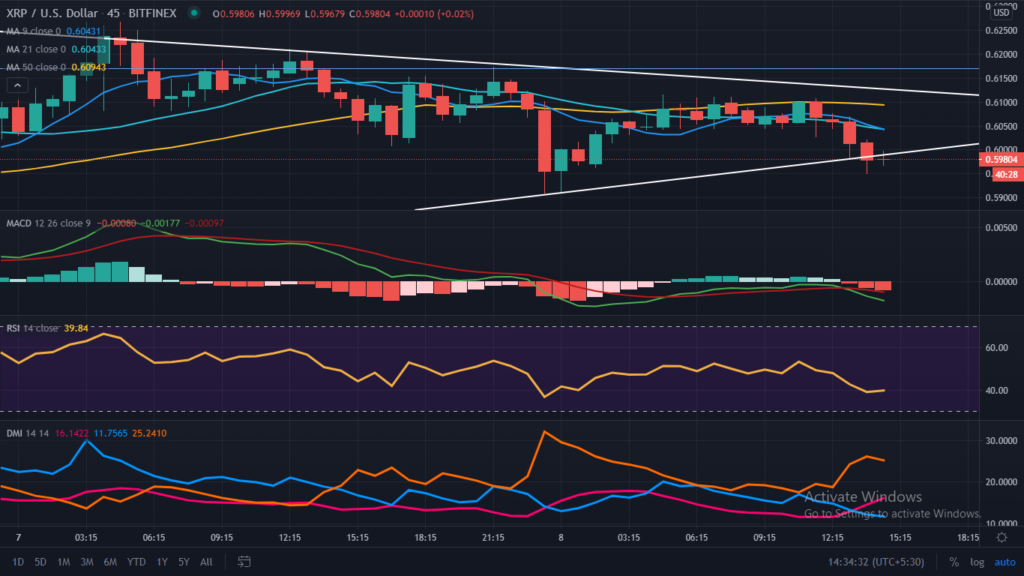
The daily chart on 45-minute time frame of XRP indicating the bearish nature as it breaks the support line on the downside and is currently trading under the moving averages of 9, 21, and 50-Day moving averages at the levels of $0.6011 with a loss of -2.40% in the last 24-hours. Volume recorded in the last 24-Hours of $7,242,260,046 and market capitalization stands at $27,358,057,789. Intraday support is placed at $0.5700, and $0.5400 on the higher side resistance is placed at $0.7300 and $0.7700.
The Relative Strength Index (RSI), which indicates the strength of XRP, is currently trading at 28.97, indicates weak strength at current levels.
Directional Movement Index (DMI) is trading with the significance of -DI over +DI indicates the bearish movement from current levels.
Moving Average Convergence Divergence (MACD) indicates the trend. Currently, it indicates the bearish trend on the intraday chart as it gives a negative crossover with the significance of Bear’s line (red) over Bull’s line (blue) with no sign of recovery.
Resistance levels: $0.7650
Support levels: $0.5000 and $0.4700
Join The Coin Republic’s Telegram Channel for more information related to CRYPTOCURRENCY NEWS and predication.
Mr. Pratik chadhokar is an Indian Forex, Cryptocurrencies and Financial Market Advisor and analyst with a background in IT and Financial market Strategist. He specialises in market strategies and technical analysis and has spent over a year as a financial markets contributor and observer. He possesses strong technical analytical skills and is well known for his entertaining and informative analysis of the Financial markets.


