
 Home
Home News
News

- XRP slips around -10.02% in today’s trading sessions trading near the crucial support of $0.5100
- The pair of XRP/BTC currently standing at 0.00003028 BTC with intraday loss of -3.84%
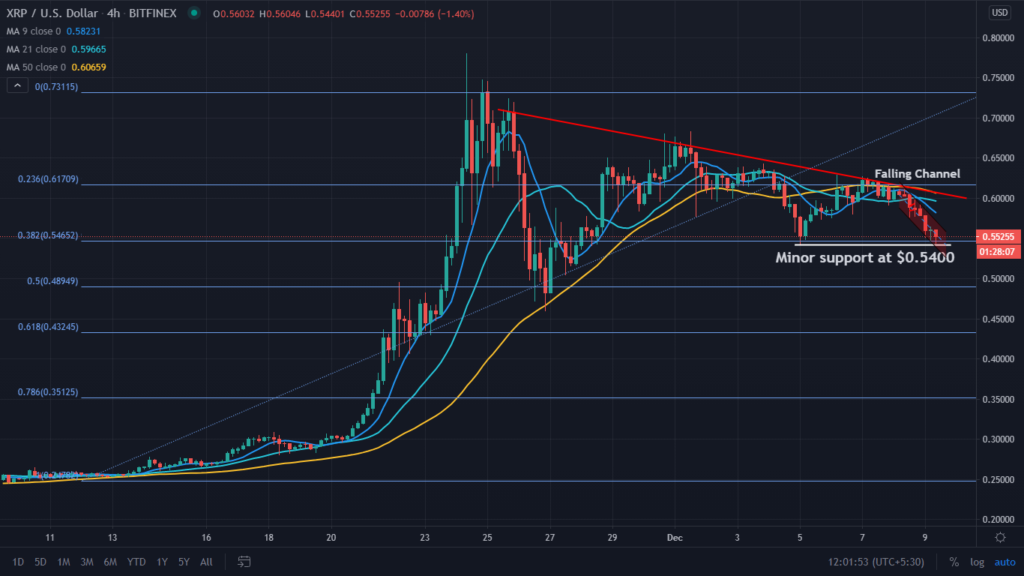
XRP/USD, on the monthly chart facing the resistance of the sloping line and on 9th December’s trading session as it slips more than -10.02% currently trading at the level of $0.5500, however, on the downside the crucial levels as support is at $0.5100 and $0.4700 while for the long term the strong support is at $0.3000. After the bullish movement, XRP hits a new 52-week high of $0.7680, and profit booking pulls XRP ripple price to the lower level of 0.4600 in USD. On the higher side, resistance is placed at $0.7680 and $0.8000 on the XRP chart. Currently, it is trading under the Moving Averages of 9, 21 and 50 Day, indicating the negative trend in the short term frame.

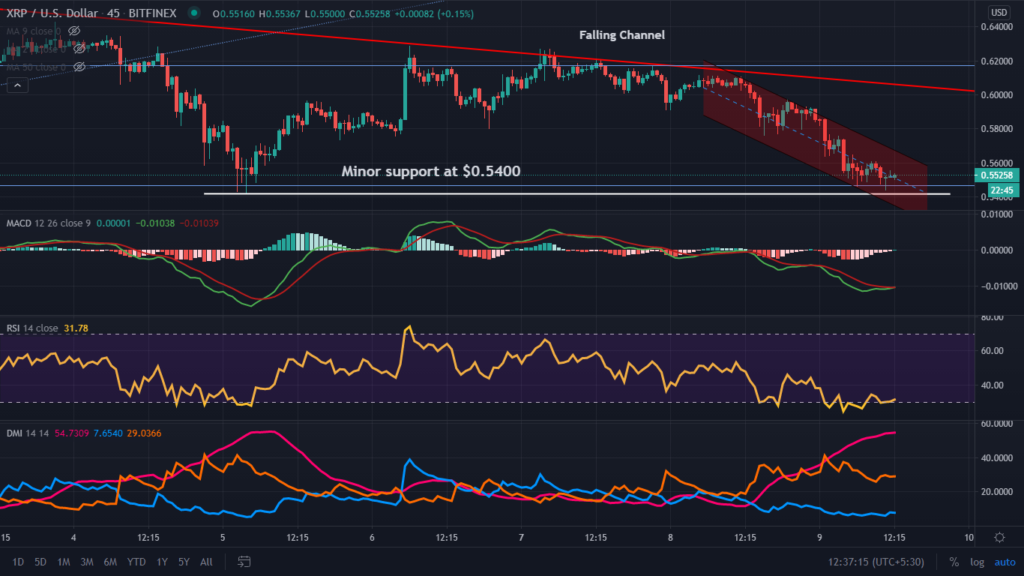
The XRP chart of one day is trading in the falling channel pattern after testing a higher trend line, and it pushes the coin towards the support of $0.5400. XRP current price is $0.5100 trading with an intraday loss of -10.02% with the volume traded in the last 24-Hours of $9,459,887,584 and the total market capitalization stands at $25,066,709,464. For intraday, it has support at $0.5400 and $0.5100 while resistance is placed at $0.6100 and $6400.

The Relative Strength Index (RSI), which indicates the strength of XRP is trading at 30.90 and still trading flat near the oversold zone after a negative divergence from higher levels.
Directional Movement Index (DMI) is trading with the significance of -DI over +DI indicating bearish momentum; however, a -DI line and +DI line is still trading parallel to each other indicating signicince of bearish trend.
Moving Average Convergence Divergence (MACD) indicates the bearish trend on the intraday chart. It gives a negative crossover with the significance of Bear’s line (red) over Bull’s line (blue), however, a positive crossover can be expected intraday as a bull line is heading towards the red line.
Resistance level: $0.7680 and $0.8000
Support level: $0.5100 and $0.4700.
Join The Coin Republic’s Telegram Channel for more information related to CRYPTOCURRENCY NEWS and predication.
Mr. Pratik chadhokar is an Indian Forex, Cryptocurrencies and Financial Market Advisor and analyst with a background in IT and Financial market Strategist. He specialises in market strategies and technical analysis and has spent over a year as a financial markets contributor and observer. He possesses strong technical analytical skills and is well known for his entertaining and informative analysis of the Financial markets.


