
 Home
Home News
News

- OMG slips over -15.48% in the last seven days after breaching the major support levels of $3.20 now moving towards the support of $3.05 and $2.55
- The pair of OMG/BTC 0.00017547 BTC trading with an intraday loss of -2.61%
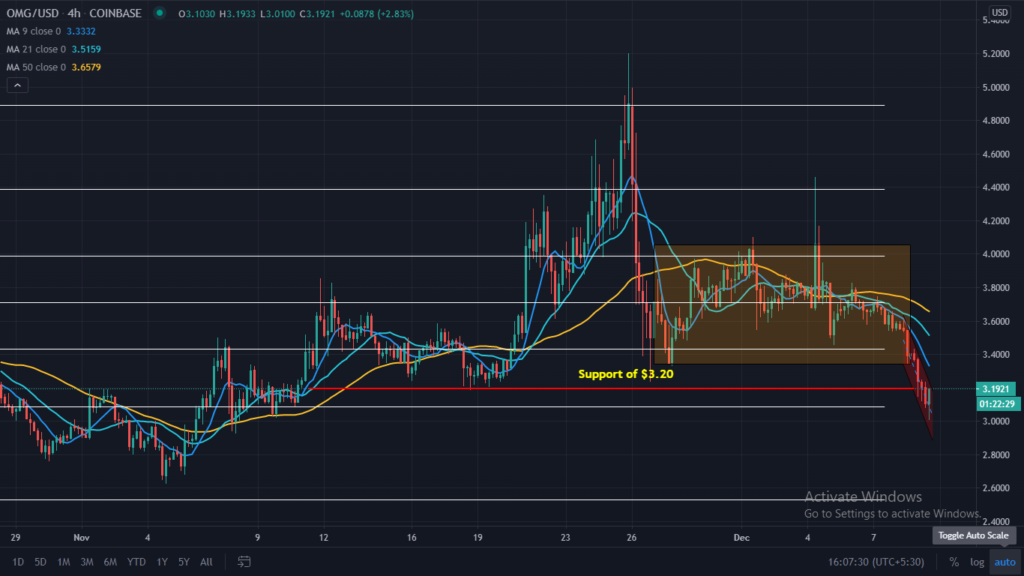
OMG network on the monthly chart is facing downtrend after hitting high of $5.04 and also breaks important levels of $3.20. The consolidation of the range of last 15- days is a breakdown on 9- December after the negative crossover of 9 and 21-Day Moving Average (DMA) line over 50-DMA. After the breakdown of the range of $4.05 and $3.35 high and lows respectively, it forms the falling channel pattern and is currently heading towards lower levels of $2.65, and can bounce from these levels. OMG is currently trading below the 9, 21 and 50-DMA line suggesting a strong bearish trend in coming trading sessions. Resistance on the higher side is placed at $4.05 and $5.05; on the other hand, support is placed at $3.05 and $2.55.

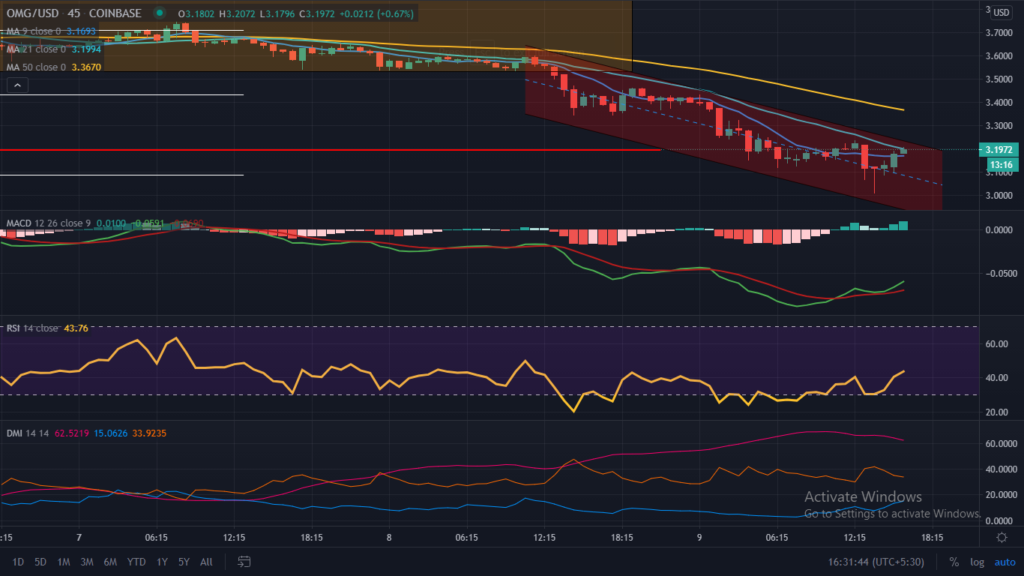
OMG Network, on the daily chart it is trading with the falling channel pattern after breaking the consolidation range a sharp correction is seen in intraday as losses over -7.24% standing at $3.19. Volume trades in the last 24-Hours is $186,004,238, and the total market capitalization stands at $445,683,779. It is currently trading under 9, 21 and 50-Day Moving Averages. However, it is currently trying to trade above 9 and 21- DMA. For intraday support is placed at $3.03 and resistance at $3.58.

The Relative Strength Index (RSI), which indicates the strength of XRP is trading at 45.11. After testing the oversold zone, it is currently heading towards overbought, indicating the recovery from lower levels.
Directional Movement Index (DMI) is trading with the significance of -DI over +DI, indicating bearish momentum. However, it is now not giving any clear indication.
Moving Average Convergence Divergence (MACD) indicates the trend. Currently, it indicates the bullish trend on the intraday chart as gives a positive crossover with the significance of Bull’s line (blue) over Bear’s line (red) is observed indicating bullish momentum in intraday.
Support levels: $3.05 and $2.55.
Resistance levels: $4.05 and $5.05
Join The Coin Republic’s Telegram Channel for more information related to CRYPTOCURRENCY NEWS and predication.
Mr. Pratik chadhokar is an Indian Forex, Cryptocurrencies and Financial Market Advisor and analyst with a background in IT and Financial market Strategist. He specialises in market strategies and technical analysis and has spent over a year as a financial markets contributor and observer. He possesses strong technical analytical skills and is well known for his entertaining and informative analysis of the Financial markets.


