
 Home
Home News
News


- After facing significant negative reversals from the major resistance level of $90.00 resulting in a negative breakout below $80, Litecoin price faced an overall loss of -18.65% over the week
- The current Litecoin price levels looked vulnerable for negative crossover below the crucial mark of $70.00 while having an overall loss of -6.00% over the day
- The LTC/BTC pair continued to trend negative with a loss of -3.25%, bringing the current level down to 0.00399759 BTC.
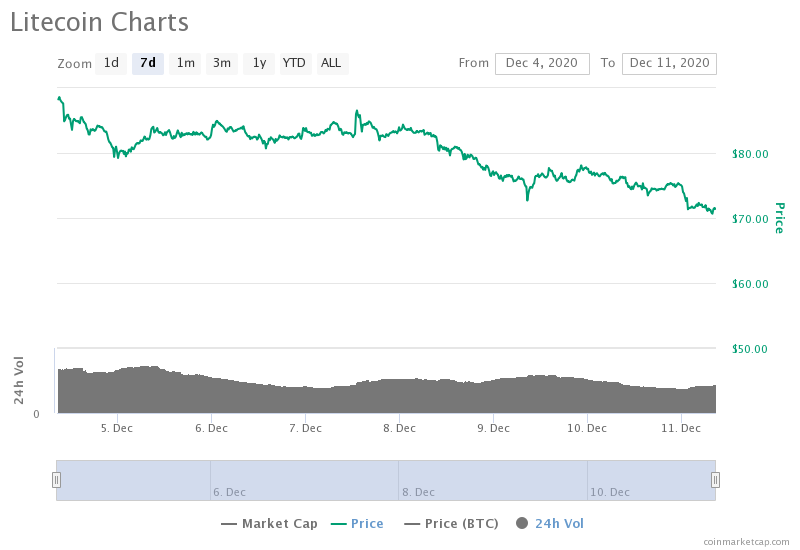
On the weekly price performance chart, Litecoin price levels faced significant negative reversals from the resistance level of $90.00 and started its negative trend. During the inception of the trend, the price levels were having significant support placed at $80.00, which was later broken below as the overall market conditions also turned considerable bearish. The negative breakout was a bearish indicator for the digital asset and continued its negative momentum from the past couple of days. Currently, the price levels are looking for sustainability above the crucial mark of $70.00 with the CMP of $71.13 while facing an overall loss of -6.08% over the day. The market capitalization is at $4,726,669,355 and the 24-hour volume traded of $3,559,000,909. The negative performance of the LTC/BTC pair might indicate that there is more potential downfall for the crypto asset in the upcoming trading sessions.

Technical Levels Suggests Revival of Positive Momentum After a Drop To Major Support Level for Litecoin Price
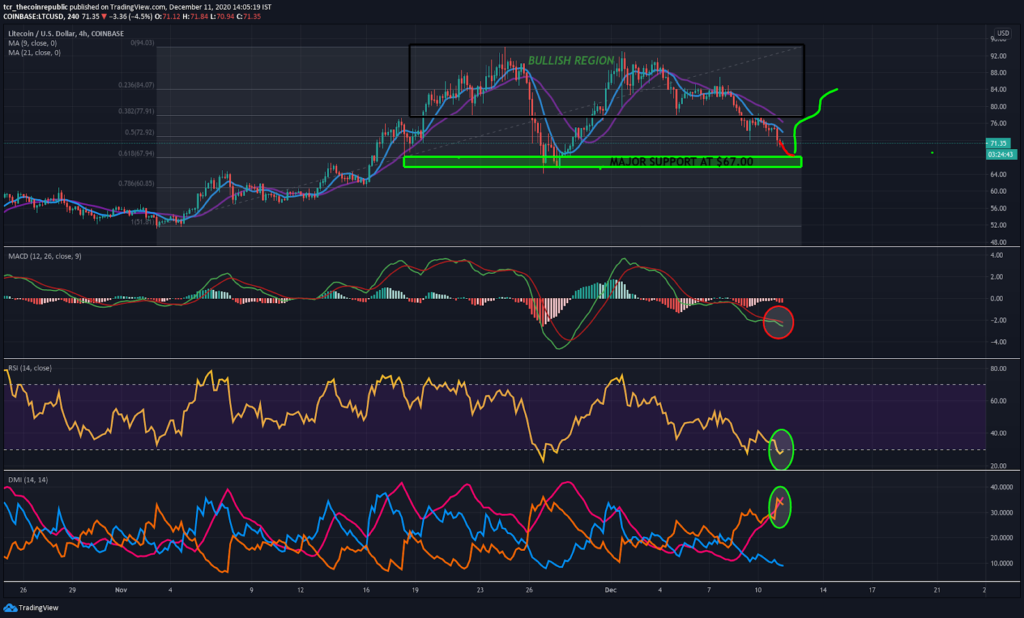
The technical chart of Litecoin price level highlights the gradual positive momentum built by the bulls in the previous month followed by price corrections at regular intervals. The price behavior of the crypto asset has formed an inverse head and shoulder pattern in the chart. The current price levels have suffered a negative breakout below the 0.5fib level and will be looking to build sustainability above the 0.618fib level. If the testing of the major support level of $67.00 is witnessed in the upcoming sessions, we can expect the price levels have a positive bounceback.
On the contrary, if the support level is broken below, it can be a significantly bearish indicator which might force the levels down to the 1.00fib level ($50). As of now, the overall sentiment for the digital asset remains bearish as 21-MA had a positive crossover against 9-MA and the current price levels trading below both of them.
The moving average convergence & divergence faced a bearish crossover indicating a more potential downtrend for the price levels.
The relative strength index (RSI) has touched the oversold region with the current level of 27.00 and might look to improve the levels in the upcoming trading sessions.
The directional movement index (DMI) has somehow increased the potential of a positive bounce for LTC, as ADX (35.64) managed to have a positive crossover against -DI (33.03).
Resistance level: $90.00
Support level: $67.20 & $50.00
Join The Coin Republic’s Telegram Channel for more information related to CRYPTOCURRENCY NEWS and predication.
Mr. Pratik chadhokar is an Indian Forex, Cryptocurrencies and Financial Market Advisor and analyst with a background in IT and Financial market Strategist. He specialises in market strategies and technical analysis and has spent over a year as a financial markets contributor and observer. He possesses strong technical analytical skills and is well known for his entertaining and informative analysis of the Financial markets.


