
 Home
Home News
News

- Uniswap slips over -9.58% in intraday after breaking 200-Day Moving Averages and heading towards 52-week lows again.
- The pairs of UNI/BTC and UNI/ETH also trading in red with a loss of about -6% standing at 0.00016651 BTC and 0.00546149 ETH respectively.
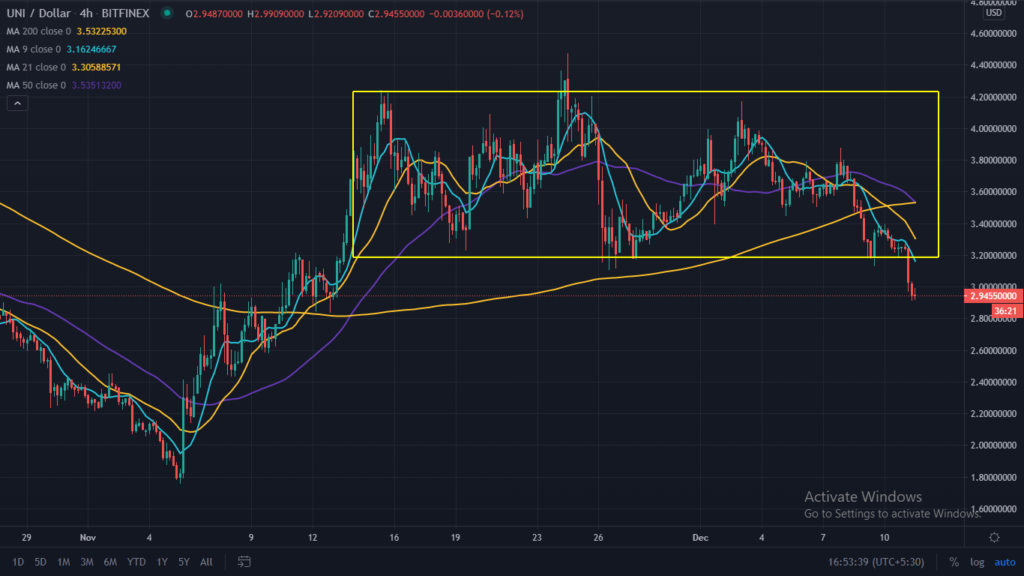
The monthly chart of Uniswap (UNI) indicating a bearish nature after a sharp bounce from the lower levels of $1.78 however after a bounce a consolidation is seen but a breakdown is seen in last few trading sessions as UNI is trading below 200-Day Moving Averages indicating a bearish trend in the coming days. In contrast, the 9, 21 and 50-DMA lines also crossing 200-DMA in fresh downside indicates bearish signal. There is no major support on downside only the level of $1.78 is strong support, on higher side resistance is placed at $3.87 and $4.48. In the last seven days, it losses around -23.20% can be a sharp trend reversal for the digital asset.

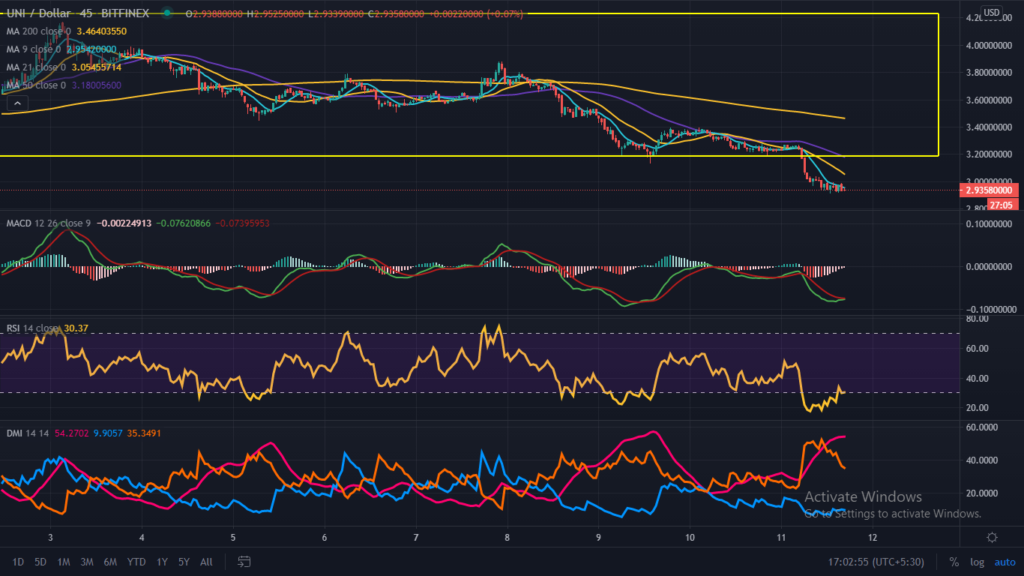
Uniswap (UNI) after the intraday blood bath currently indicates some recover from current levels if the market supports the bullish movement. The daily chart over 45-Minute time frame indicates suitability at these levels. Uniswap still trading bellow major levels of 9, 21 and 50-DMA for bullish movement or recovery it must trade above 9-DMA. The coin is currently trading at $2.93 with intraday loss of -9.58%. The volume traded in the last 24-Hours is $492,351,978, and the total market capitalization stands at $738,292,957. For intraday support levels can be considered as $2.83 and on higher side resistance is placed at $3.37.

The Relative Strength Index (RSI) indicates the strength of UNI is trading at 29.70 after correcting from the higher levels currently indicating recovery as heading towards overbought zone from the oversold region.
Directional Movement Index (DMI) is trading with the significance of -DI line over +DI line indicating bearish nature, however, now -Di line is heading towards +DI line can be considered positive for the short term.
Moving Average Convergence Divergence (MACD) indicates the trend. Currently, it indicates the bearish trend on the intraday chart as gives a negative crossover with the significance of Bear’s line (red) over Bull’s line (blue), however, a positive crossover is expected as the blue line is heading towards red line suggesting recovery from current levels.
Support levels: $1.78
Resistance levels: $3.87 and $4.48
Join The Coin Republic’s Telegram Channel for more information related to CRYPTOCURRENCY NEWS and predication.
Mr. Pratik chadhokar is an Indian Forex, Cryptocurrencies and Financial Market Advisor and analyst with a background in IT and Financial market Strategist. He specialises in market strategies and technical analysis and has spent over a year as a financial markets contributor and observer. He possesses strong technical analytical skills and is well known for his entertaining and informative analysis of the Financial markets.


