
 Home
Home News
News

- Ripple token XRP is trading near the support zone of $0.47 to $0.51 before the event of SPARK airdrop.
- Despite this major event XRP is trading under pressure with intraday loss of -5.75% stands at $0.5275
- The pair of XRP/BTC is trading with a drop of -7.54% at 0.00002894 BTC
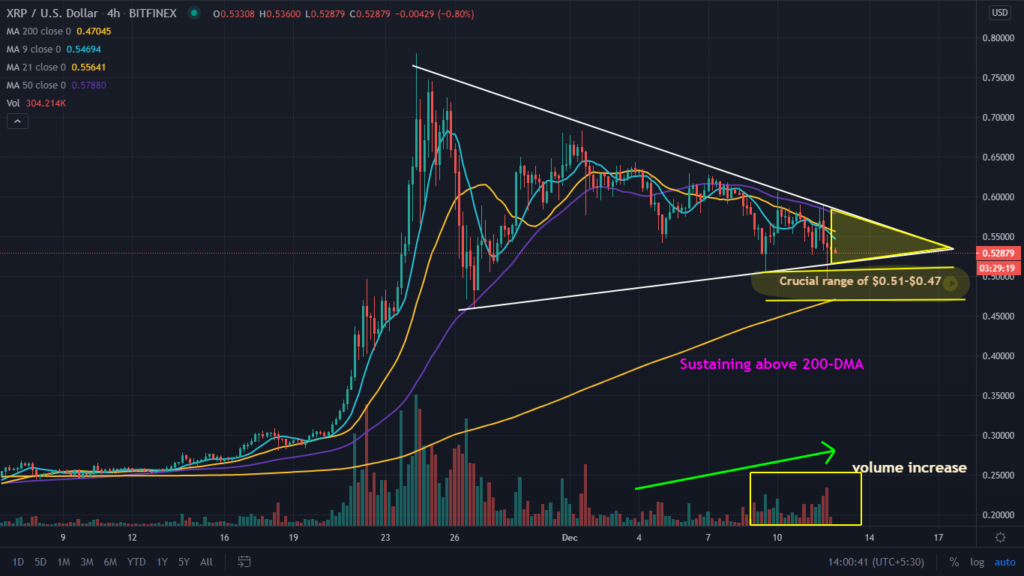
Ripple XRP on December 12th, is preparing for an airdrop event in which XRP holders can participate in a 1:1 SPARK token distribution against their current holdings. Participants must have an exchange account on exchanges that support SPARK airdrop including compatible exchanges like Kraken, Coinbase, Bitbay, Bitstamp, OKEx, Houbi and Binance. A spike in volume is seen before event.

Ripple XRP/USD before the event of the airdrop, is trading in pressure with an intraday loss of -5.75% on December 12, 2020. XRP is trading on the monthly chart in a symmetrical triangle pattern. Currently, it is near about to complete the triangle, while looking over volume, some increment is observed from the past few trading sessions indicating the interest of investors before the major event. The coin is trading near the support zone of $0.51-$0.47 can be considered important levels if sustain above then we can expect bullish movement till the resistance of $0.59-$0.61 and if resistance breaks then we can see a target of $0.80 on the higher side. However, if support breaks then the target on the lower side will be $0.30. Investors must pay attention to the above levels in coming trading sessions.

You Might Like: XRP TRADING FLAT BEFORE THE MAJOR EVENT OF SPARK AIRDROP
Technical Indicators Indicates Positivity for Intraday
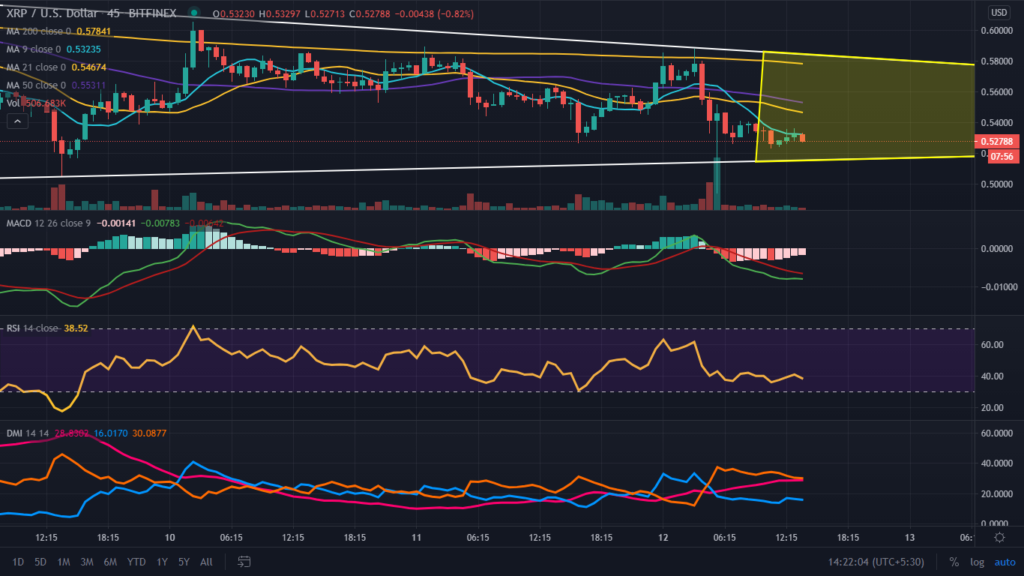
XRP on daily charts is trading in the lower range of the day. Currently placed under 9, 21, 50 and 200 Day Moving Averages creating difficulties for bullish movement in the coming trading sessions where 200-DMA is placed at $0.57 which can be considered as a resistance for the short-term. The volume recorded in the last 24-hours is $11,070,580,218, which is slightly higher than yesterday’s volume. The total market capitalization stands at $23,931,405,495 at the time of writing.
The Relative Strength Index (RSI) indicates the strength of XRP is trading at 38.24. Currently trading near oversold zones and moving flat with no major movements.
Directional Movement Index (DMI) is trading with the significance of -DI line over +DI line indicating bearish nature, however, now -Di line is heading towards +DI line can be considered positive for the short-term.
Moving Average Convergence Divergence (MACD) indicates the trend. Currently, it indicates the bearish trend on the intraday chart as it gives a negative crossover with the significance of Bear’s line (red) over Bull’s line (blue). However, a positive crossover is expected as the blue line is heading towards the red line suggesting recovery from the current levels.
Support levels: $0.51-0.47
Resistance levels: $0.76-$0.80
50-Day Moving Averages: $0.5520
200-Day Moving Averages: $0.5780.
Join The Coin Republic’s Telegram Channel for more information related to CRYPTOCURRENCY NEWS and predication.
Mr. Pratik chadhokar is an Indian Forex, Cryptocurrencies and Financial Market Advisor and analyst with a background in IT and Financial market Strategist. He specialises in market strategies and technical analysis and has spent over a year as a financial markets contributor and observer. He possesses strong technical analytical skills and is well known for his entertaining and informative analysis of the Financial markets.


