
 Home
Home News
News

- Stellar (XLM) breaks a resistance line indicating a bullish momentum in the short term trading at $0.1735 with an intraday gain of +8.20%
- The pair of XLM/BTC is trading at 0.00000904 BTC with an intraday gain of+5.60%
- Stellar gave a positive breakout from the descending triangle pattern and sustaining above 50-DMA successfully
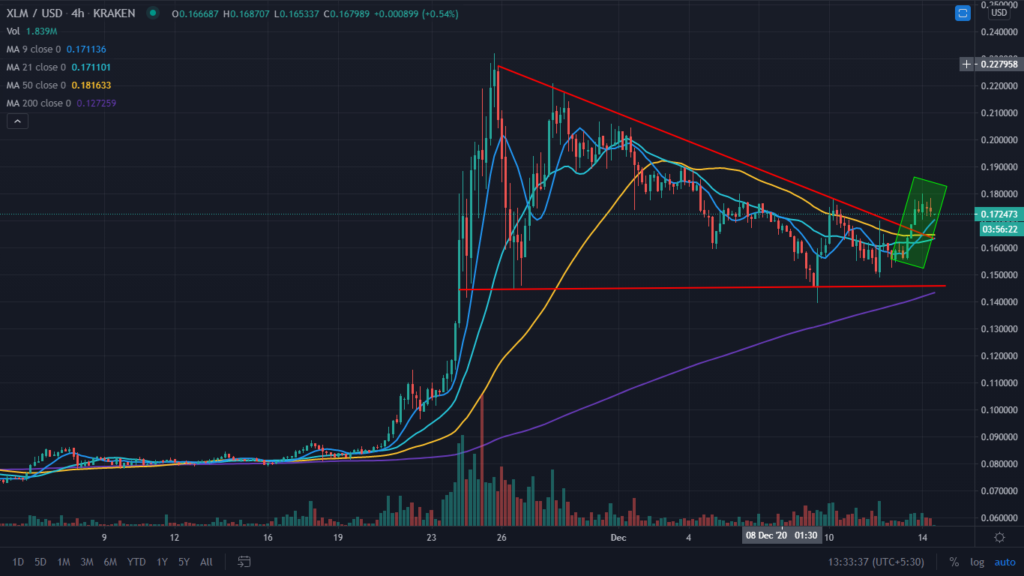
Stellar (XLM) over the monthly chart, after making a new 52-week high of $0.2297, finally had a positive breakout from the descending triangle pattern on 13th December and currently sustaining above the 9, 21, 50, and 200-Day Moving Averages. In the mid-month of November, a short buying is seen in XLM supported by the volume, and after hitting a new high, a profit booking pulls it to the lower level of $0.1400. Again recovery pulls it to higher levels, but it faces resistance and trading under a descending triangle pattern, and a breakout is observed. The higher side’s resistance is placed at $0.2050 and $0.2300, and on the lower side, support is placed at $1400 and $0.0800.

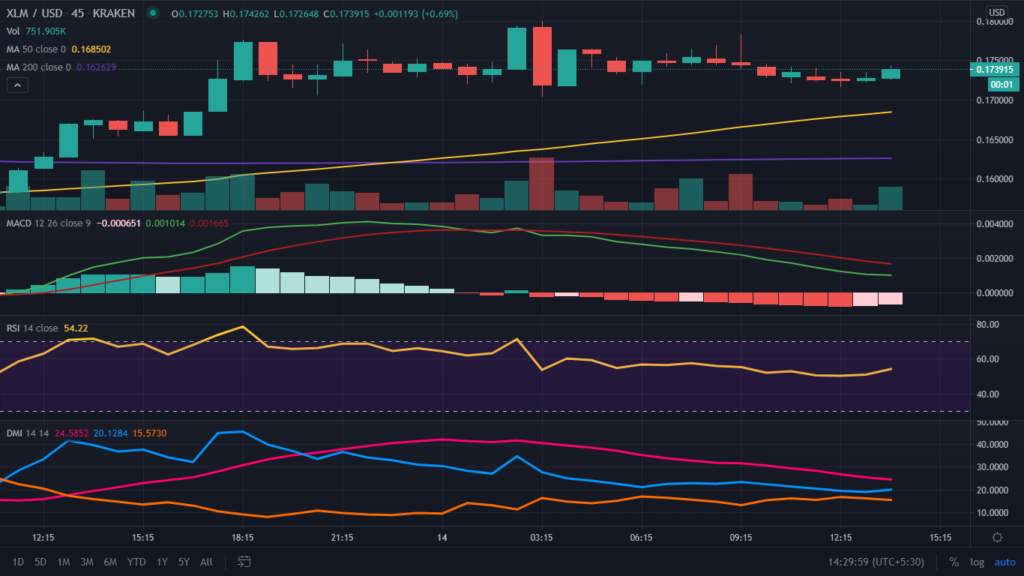
XLM/USD is trading at $0.1735, with an intraday gain of +8.20%, supported by the last 24-Hours of $737,119,971, and the total market capitalization stands at $3,772,610,065. A golden crossover is seen in the intraday of 50-DMA over 200-DMA indicates positive for the short term. The higher side’s resistance is placed at $0.1800, and support on the lower side is placed at $0.1550. In the last seven days, it is trading with minor gains of +0.25%.

The Relative Strength Index (RSI), which indicates XLM strength, is trading at 47.47 and still heading towards the oversold zone after a sharp fall from higher levels.
Directional Movement Index (DMI) is trading with a significance of +DI over -DI, indicating bullish momentum.
Moving Average Convergence Divergence (MACD) indicates the trend. Currently, it indicates the bearish trend on the intraday chart as it gives a negative crossover with the significance of Bear’s line (red) over Bull’s line (blue) with no sign of recovery.
Support levels: $1400 and $0.0800
Resistance levels: $0.2050 and $0.2300
Join The Coin Republic’s Telegram Channel for more information related to CRYPTOCURRENCY NEWS and predication.
Mr. Pratik chadhokar is an Indian Forex, Cryptocurrencies and Financial Market Advisor and analyst with a background in IT and Financial market Strategist. He specialises in market strategies and technical analysis and has spent over a year as a financial markets contributor and observer. He possesses strong technical analytical skills and is well known for his entertaining and informative analysis of the Financial markets.


