
 Home
Home News
News

- Zcash looking for a breakout or breakdown from the descending triangle pattern, currently trading with a minor gain of +1.695%
- The pair of ZEC/BTC also performed well with an intraday gain of +1.06% standing at 0.00351244 BTC
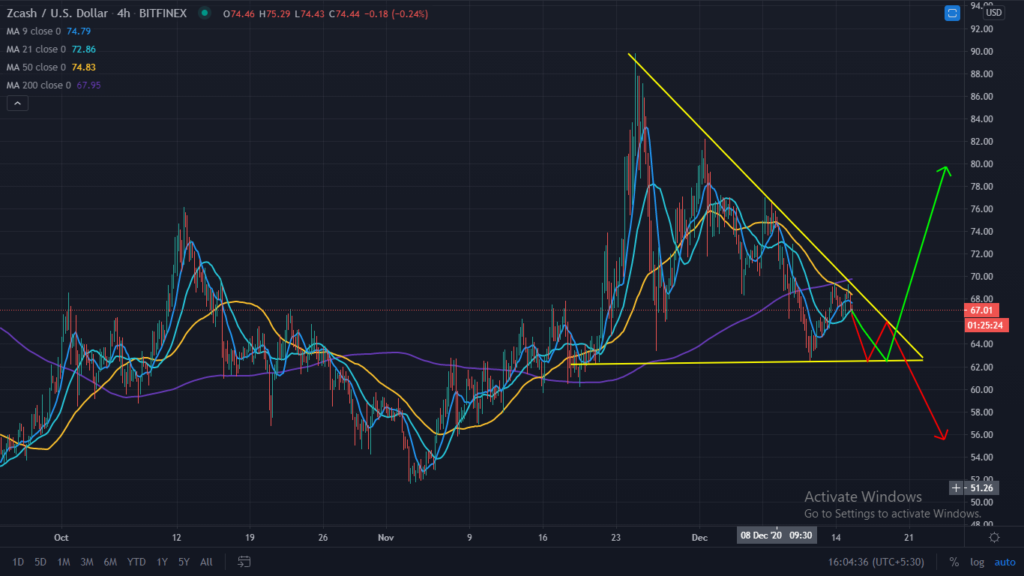
Zcash is trading in the descending triangle pattern after a bullish movement from the lower levels of $50.84 to the monthly high of $90.35. Now it is trading in the descending triangle pattern. After a bullish movement, it is currently placed under the 9, 21, 50, and 200-Day Moving Averages. The target on the higher side is $75, $80, and $85 after a breakout from this pattern and the target after a breakdown on the lower side is $60 and $55. The resistance on the higher side is placed at $90.35 and $102.20, and support on the lower side is placed at $62.00, and the strong support is $50. For another big upside is must sustain above important levels of 50 and 200-DMA

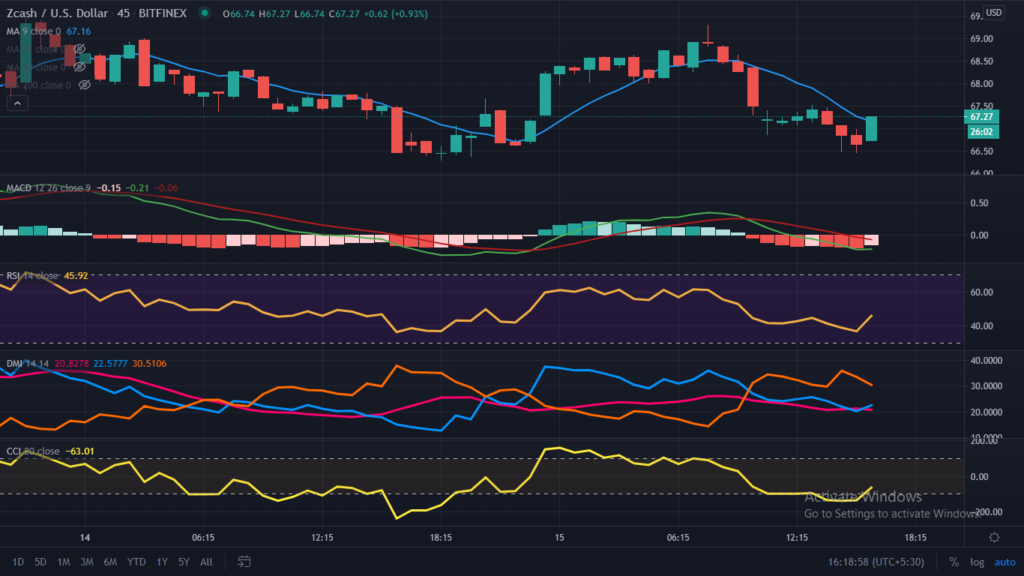
Zcash over the daily chart is trading flat and indicating the bullish movement for a rest day as trading with the supported indicators. For intraday, it must be placed above 9-DMA or can say short term moving averages. Currently standing at $67.68 with the 24-Hours gain of +1.69% over the last seven days it stands at a loss of -7.52%. The volume traded in the last 24-hours of $195,399,283, and the total market capitalization stands at $723,287,365.

The Relative Strength Index (RSI), which indicates the strength of ZEC is trading at 48.23, and it is heading towards the overbought zone after testing lower levels.
Directional Movement Index (DMI) is trading with the significance of -DI over +DI, indicating bearish momentum but also indicates the sign of recovery.
Moving Average Convergence Divergence (MACD) which indicates the trend and currently it indicates the bearish trend on the intraday chart as gives negative crossover with the significance of Bear’s line (red) over Bull’s line (blue), but now heading for a positive crossover as blue line heading towards the red line.
Support levels: $62.00 and $50
Resistance levels: $90.35 and $102.2
Join The Coin Republic’s Telegram Channel for more information related to CRYPTOCURRENCY NEWS and predication.
Mr. Pratik chadhokar is an Indian Forex, Cryptocurrencies and Financial Market Advisor and analyst with a background in IT and Financial market Strategist. He specialises in market strategies and technical analysis and has spent over a year as a financial markets contributor and observer. He possesses strong technical analytical skills and is well known for his entertaining and informative analysis of the Financial markets.


