
 Home
Home News
News

- Bitcoin Cash (BCH) is trading in the green after bouncing from 200-Day Moving Averages
- The pair of BCH/BTC is trading in red with a minor loss of -0.97%, standing at 0.01466756 BTC
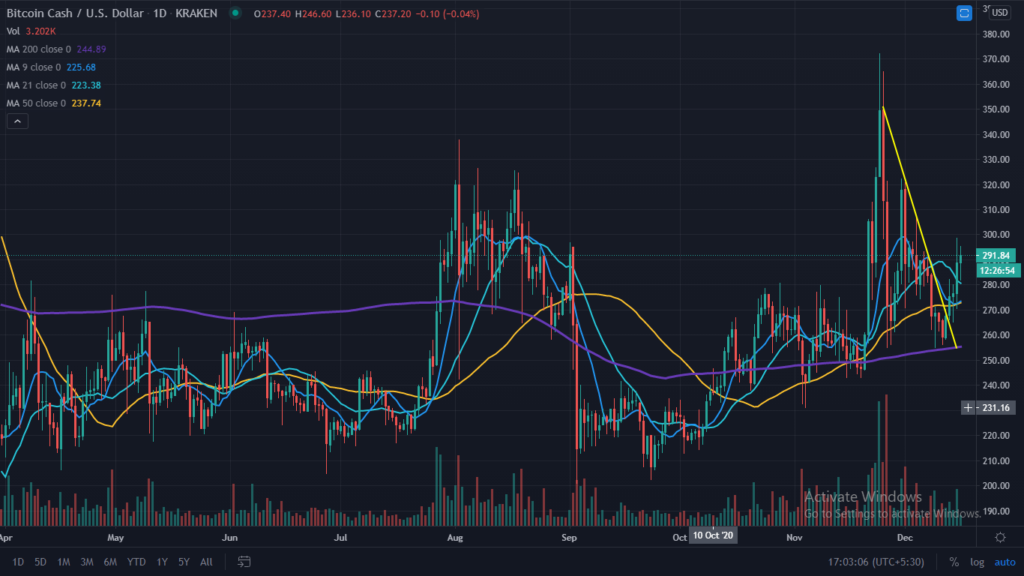
Bitcoin Cash (BCH) is trading above the 200-DMA after making a new 90-Day high of $368. It breaks a higher side’s resistance line and is currently trading above it with an intraday gain of +1.26%. Over the past seven days, it gained over +10.81%. It is currently trading above 9, 21,50, and 200-Day Moving Averages, indicating the positive momentum for upcoming trading sessions. After making a high of $368, the profit booking pulls it to the lower levels of $255, and the price recovery pulls it up; however, it is trading with facing resistance. After clearing resistance, the new resistance will be $370 and $500; however, on the lower side, support is placed at $240 and $200.

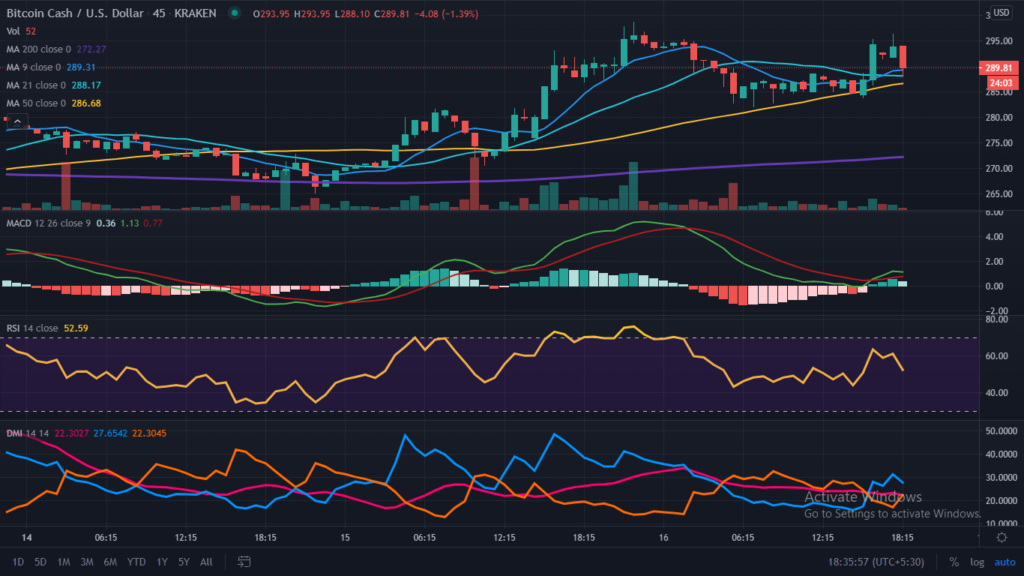
BCH’s intraday chart indicates the bullish momentum, from the lower levels of $282 to $298 lows and highs, respectively. BCH’s current price is trading at $293, with an intraday volume of $2,712,667,710, and the total market capitalization stands at $5,456,529,449. For intraday, the support is placed at $271. The higher side’s resistance is placed at $300. Over the daily chart, it is trading above the 9-day short-term moving averages indicating the positive momentum for the short term.

The Relative Strength Index (RSI) is trading at 50.32 and heading towards the oversold zone after correcting from the higher levels.
Directional Movement Index (DMI) is trading with the significance of+DI over -DI, indicating momentum indicating positive sentiment for BCH.
Moving Average Convergence Divergence (MACD) indicates the bearish trend on the intraday chart as it gives a negative crossover with the significance of Bear’s line (red) over Bull’s line (blue) and after a positive crossover again heading for negative crossover.
Support levels: $240 and $200
Resistance levels: $370 and $500
Join The Coin Republic’s Telegram Channel for more information related to CRYPTOCURRENCY NEWS and predication.
Mr. Pratik chadhokar is an Indian Forex, Cryptocurrencies and Financial Market Advisor and analyst with a background in IT and Financial market Strategist. He specialises in market strategies and technical analysis and has spent over a year as a financial markets contributor and observer. He possesses strong technical analytical skills and is well known for his entertaining and informative analysis of the Financial markets.


