
 Home
Home News
News

- Ripple XRP breaks the crucial support of $0.47 and now trading below providing bearish signals in the current market session.
- The pair of XRP/BTC is trading in red at 0.00002353 BTC with the loss of -8.21%
- XRP breaks the symmetric triangle pattern on the downside trading under 200-Day Moving Average
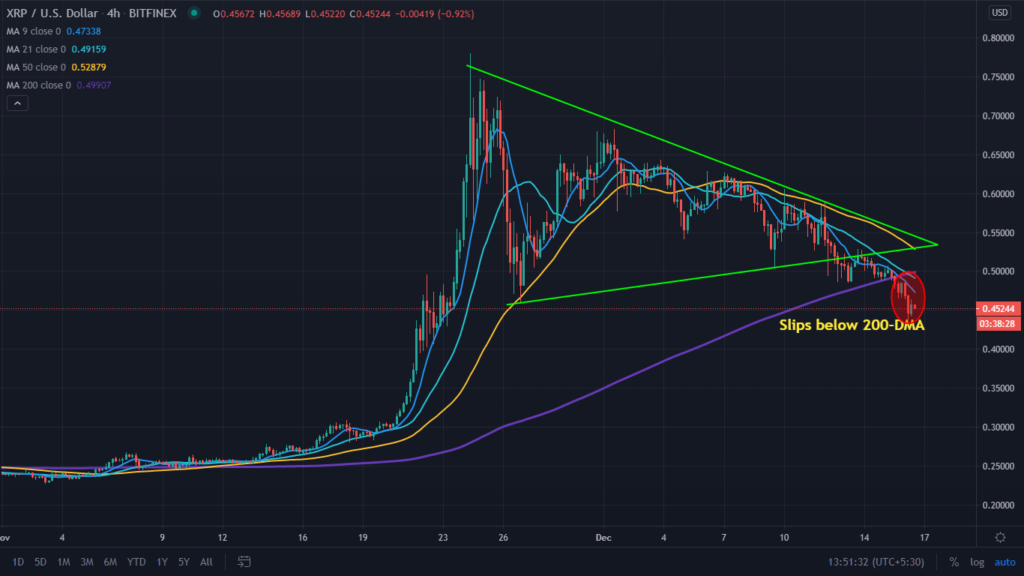
One of the most hyped crypto asset for the month, XRP, after trading in symmetrical triangle pattern breaks it to the downside and also slips under the important support of 200-DMA indicates the bearish trend in the short term. Also trading under the important moving averages of 9, 21, and 50-DMA after making the high of $0.7680 the profit booking pulls it to lower levels of $0.46 however, the price recovery pulls it to the higher levels and trades under the symmetrical triangle pattern. The event of airdrop brings profit booking in digital currency and makes it to trade at lower levels. The support on lower levels is placed at $0.44 and $0.30; however, on higher side resistance is placed at $0.60 and $0.72.

The daily chart of XRP/USD indicating the price recovered after the intraday dip. Currently, it is trading at the price levels of $0.4560 with intraday loss of -7.14%, and since the last seven days, it has slipped over -13.57%. The volume traded in the last 24-hours is $10,317,632,432 and the total market capitalization stands at $20,779,694,593. The circulating supply of XRP increases around +0.15% and stands at 45,404,028,640. The range for intraday is $0.4420 and $0.5060 as the lows and highs respectively. The intraday support is placed at $0.44, and the resistance can be considered as $0.50 and $0.52.

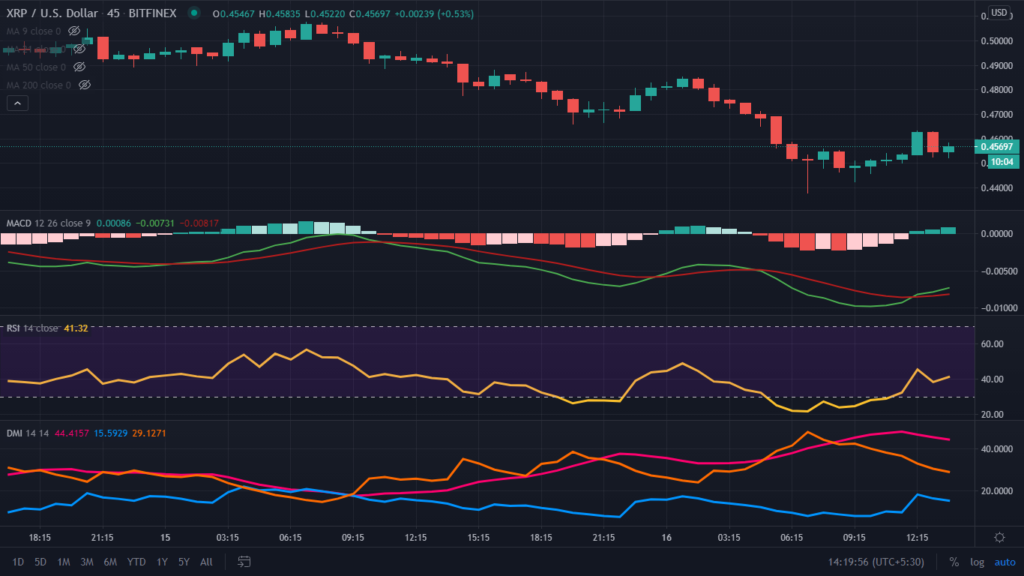
The Relative Strength Index (RSI) is trading at 40.32 and gets flat after a sharp recovery from the oversold zone.
Directional Movement Index (DMI) is trading with the significance of -DI over +DI, indicating momentum. However, the ADX is trading higher than -DI and +DI.
Moving Average Convergence Divergence (MACD) indicates the bullish trend on the intraday chart as it gives a positive crossover with the significance of Bull’s line (blue) over Bear’s line (red) with no sign of weakness.
Support levels: $0.44 and $0.30,
Resistance levels: $0.60 and $0.72
Join The Coin Republic’s Telegram Channel for more information related to CRYPTOCURRENCY NEWS and predication.
Mr. Pratik chadhokar is an Indian Forex, Cryptocurrencies and Financial Market Advisor and analyst with a background in IT and Financial market Strategist. He specialises in market strategies and technical analysis and has spent over a year as a financial markets contributor and observer. He possesses strong technical analytical skills and is well known for his entertaining and informative analysis of the Financial markets.


