
 Home
Home News
News
- Litecoin (LTC) surges over +25% after clearing the resistance zone and gives a positive breakout
- The pair of LTC/BTC is trading with an intraday gain of +2.99% standing at 0.00433840 BTC
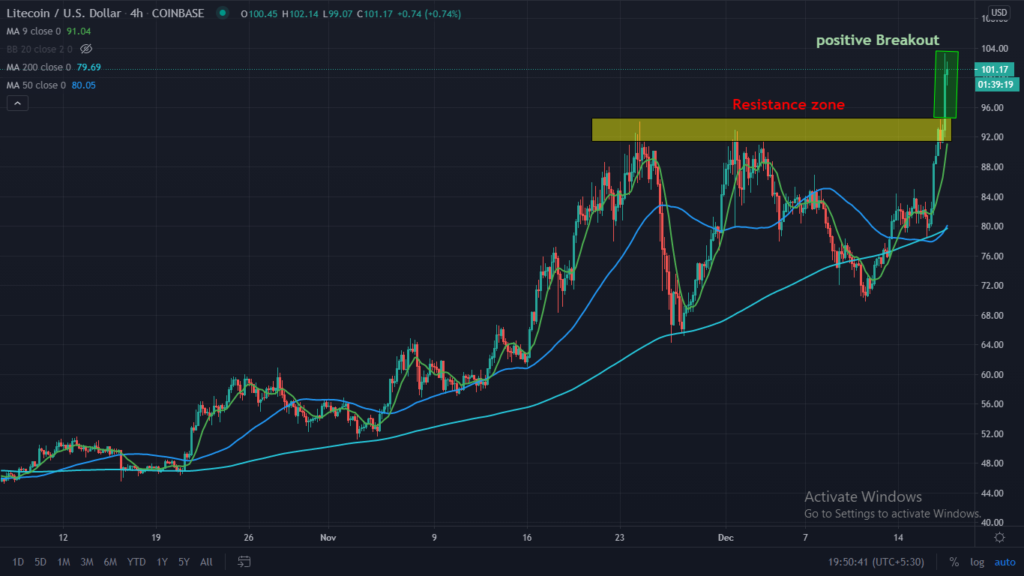
Litecoin (LTC) over the monthly chart gives a positive breakout after clearing the resistance zone of $91 to $94 on 17th December 2020. Currently, it is placed above the moving averages of 50 and 200, with no sign of weakness. The monthly chart indicates the bullish momentum of LTC jumps from the level of $42.55 to $105 as lows and highs of the last 90-days the level of $105 is recorded as the new 50-week high. The support on the lower side is placed at $65 and $42, on the other hand, the resistance on the higher side is placed at $145. The 9-DMA is now acting as the support if the price is placed above this level then we can expect the bullish rally will continue.

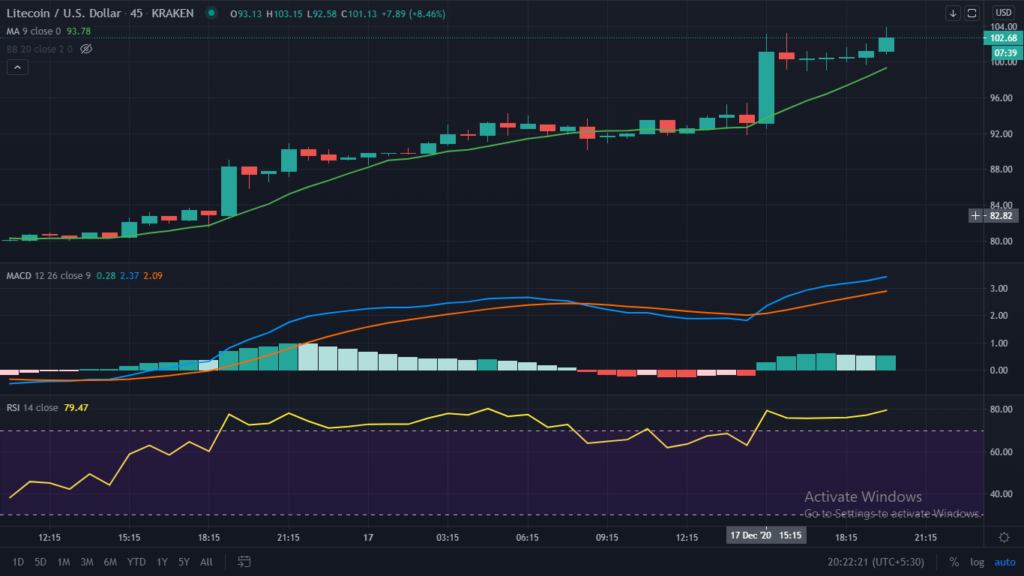
The daily chart of litecoin indicates a bullish movement after breaking the resistance of $94 and currently trading above it. The coin is placed above 9-DMA supports the bullish momentum on the intraday chart. Currently, it is trading at the price level of $105 with an intraday gain of +24.28%, supported by the volume traded in the last 24-Hours of $9,135,066,952 and the total market capitalization stands at $6,769,957,698. The intraday range of LTC is $85 to $105 as the lows and highs respectively. The support on the intraday chart is placed at $86 and currently not having any resistance on the higher side.

The Relative Strength Index (RSI) which indicates the strength of LTC is trading at 82 and it is indicating the coin is trading in the overbought zone, still heading towards higher levels.
Moving Average Convergence Divergence (MACD) currently indicates the bullish trend on the intraday chart as gives a positive crossover with the significance of Bull’s line (yellow) over Bear’s line (red) with no sign of weakness.
Support level: $65 and $42,
Resistance level: $145
Join The Coin Republic’s Telegram Channel for more information related to CRYPTOCURRENCY NEWS and predication.
Mr. Pratik chadhokar is an Indian Forex, Cryptocurrencies and Financial Market Advisor and analyst with a background in IT and Financial market Strategist. He specialises in market strategies and technical analysis and has spent over a year as a financial markets contributor and observer. He possesses strong technical analytical skills and is well known for his entertaining and informative analysis of the Financial markets.


