
 Home
Home News
News
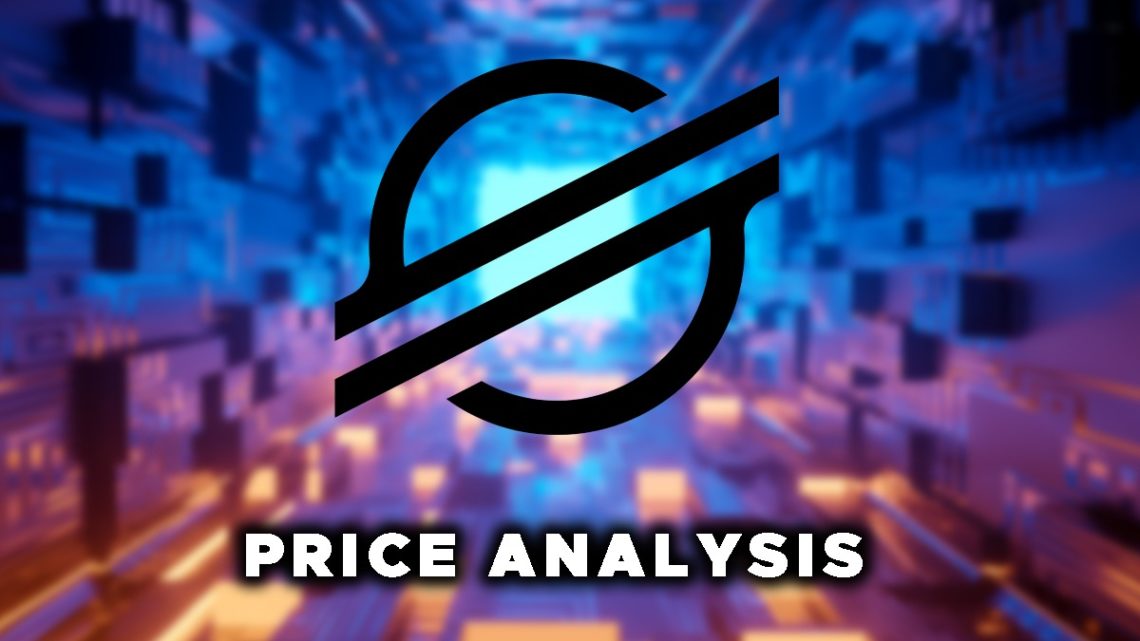
- XLM breaks the descending triangle pattern and heading for the target of $0.19
- The investors should expect bullish momentum as XLM just completed retracement from 1st wave on a higher timeframe.
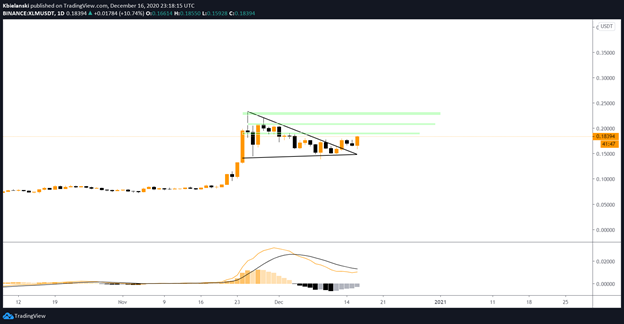
- The pair of XLM/BTC slips over 0.41% in intraday and stands at 0.00000836 BTC
Over the monthly chart, XLM gives a positive breakout from the descending triangle pattern, after a positive rally from the lower level of $0.081 to $0.23 then after a profit booking session it hits the lower levels of $0.150 can be considered the support for the short term. The price is continuously trading in descending triangle pattern and a positive breakout now targeting the higher levels of $0.190, $0.210 and $0.230 in the coming trading sessions. The support on the lower levels is placed at $0.150 and the strong support is $0.070, while the resistance on the higher side is placed at $0.230. Currently, XLM is trading above the 9, 21, 50 and 200-Day Moving Averages, indicating the strength of bullish momentum will continue.

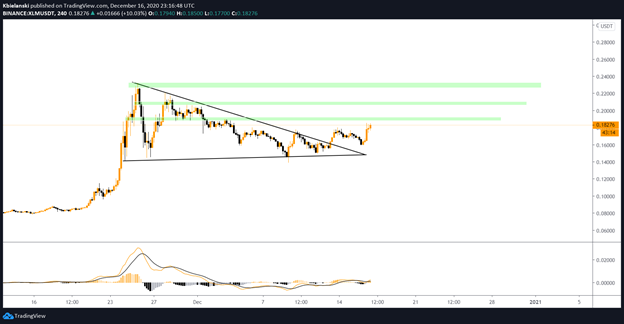
The Moving Average Convergence Divergence (MACD) currently indicates the bearish trend on the one Day chart and gives a negative crossover with the significance of Bear’s line (black) over Bull’s line (yellow), However, a positive crossover is expected as the black line is heading towards the yellow line which points out to further upside.

The daily chart of XLM indicating the bullish momentum over the lower time frame of 15-min, as trading in the pattern of higher-top lower bottom sequence. Over the daily chart, 50-DMA is acting as the support, while the 21-DMA is now heading towards the 50-DMA again indicating the bullish momentum in the coming trading sessions.
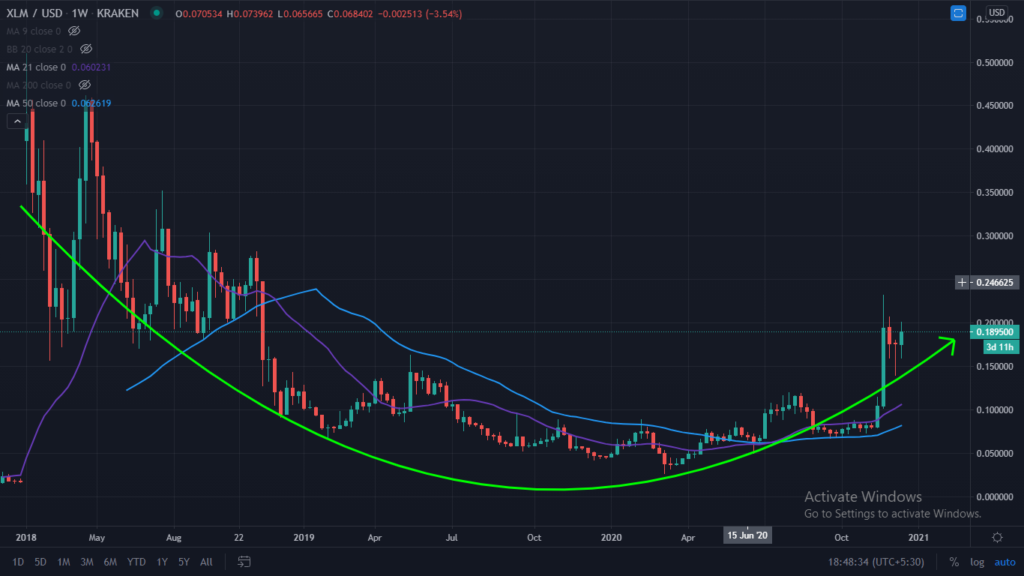
The weekly chart indicating the bullish momentum, as making the rounding bottom pattern. A bullish pin bar candle which is showing support, next candle needs to stay above to confirm an uptrend.
Support levels: $0.150 and $0.070
Resistance levels: $0.230.
Join The Coin Republic’s Telegram Channel for more information related to CRYPTOCURRENCY NEWS and predication.


