
 Home
Home News
News

- Lisk coin hitted a new monthly high now again heading for another monthly high after a profit booking session
- The pair of LSK/BTC and LSK/ETH standing at 0.00006127 BTC and 0.00215986 ETH, respectively

Lisk coin price zooms around +10.63% on 19 December and while the monthly chart is making the rounding bottom pattern heading towards the resistance zone. It is currently trading above all the major moving averages of 21, 50, and 200 days. After a positive crossover of 9, 21, and 50-DMA over 200 indicates the positive momentum. Over the weekly time frame, it is making a cup with a handle pattern, and over the weekly chart, it is trading above all moving averages. The support on the downside is placed at $1.110 and $0.940, while on the higher side, resistance can be considered $1.60 and $2.70. The target of $1.50 and $1.95 can be seen in the coming trading sessions.

Technical Levels Stays Bullish For Lisk Coin Ahead of 2021
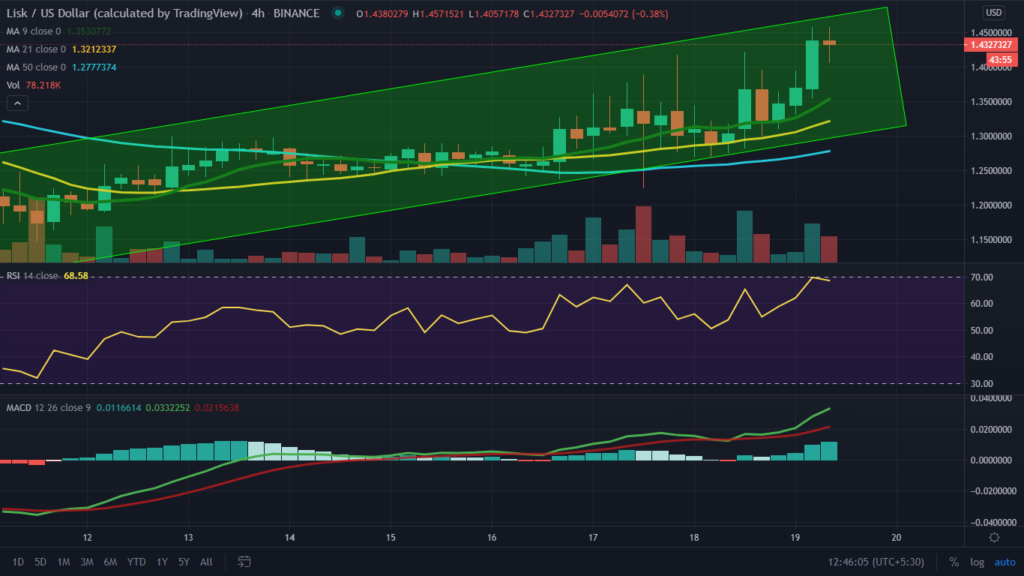
In the lower time frame of 4-Hours, Lisk (LSK) had shown bullish momentum. The chart trades in the rising channel pattern, making the higher highs and lower bottom sequence, suggesting a positive momentum. The chart gives a positive crossover of 9 and 21-DMA over 50-DMA indicates the bullish momentum. The short-term chart’s support is placed at $1.25 and $1.20, while the resistance on the higher side is placed at $1.75 and $2.10. Currently, it is trading at the price level of $1.42 with an intraday gain of +10.63, supported by the volume traded in the last 24-Hours of $7,511,145.07, and the total market capitalization stands at $179,618,977.59.

The Relative Strength Index (RSI), which indicates the strength of LSK, is trading at 70.05, and it is trading near the overbought zone after recovering from lower levels.
Moving Average Convergence Divergence (MACD) currently indicates the bullish trend on the daily chart as it gives a positive crossover with the significance of Bull’s line (green) over Bear’s line (red) with no sign of weakness.
Support levels: $1.110 and $0.940
Resistance levels: $1.60 and $2.70
Mr. Pratik chadhokar is an Indian Forex, Cryptocurrencies and Financial Market Advisor and analyst with a background in IT and Financial market Strategist. He specialises in market strategies and technical analysis and has spent over a year as a financial markets contributor and observer. He possesses strong technical analytical skills and is well known for his entertaining and informative analysis of the Financial markets.


