
 Home
Home News
News

- EOS over the weekly time frame is trading in the symmetrical triangle pattern, and the breakout can hit the levels of $4.95 and $6.70
- The pair of EOS/BTC is trading in the red with an intraday loss of -2.59%, standing at 0.00013171 BTC
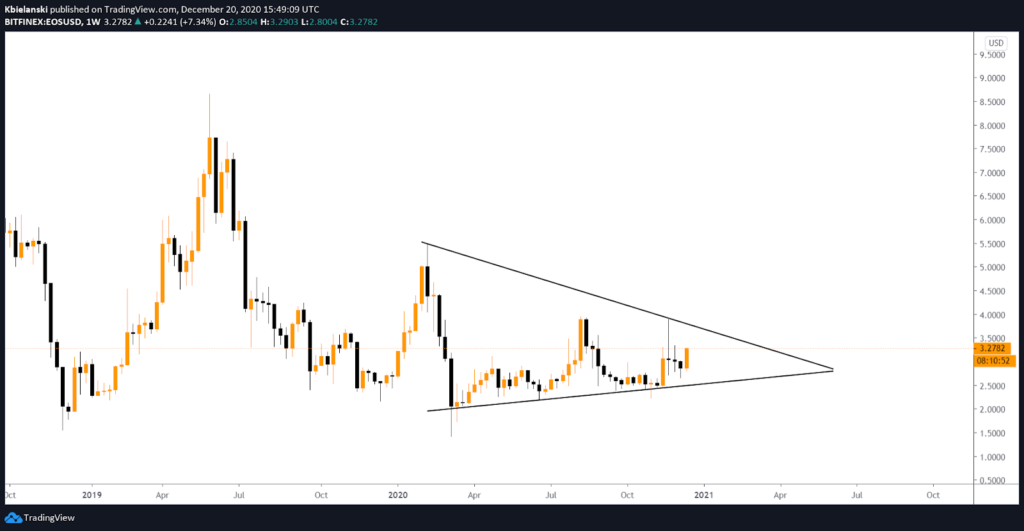
EOS/BTC is trading in the symmetrical triangle pattern over the weekly chart it taking support from the rising support line of the pattern. It is currently trading near the resistance zone as the breakout from this pattern can give a massive rally on the upside for the targets of $4.48, $4.95, and $6.71. EOS is trading at the price levels of $2.98 with an intraday loss of -5.81%, the volume traded in the last 24-Hours of $4,264,610,363, and the total market capitalization stands at $2,795,289,915. The support on the lower levels is placed at $2.45 and $2.20, while on the higher side, resistance is placed at $3.35 and $3.95, and the volume is not supported for the bullish momentum.

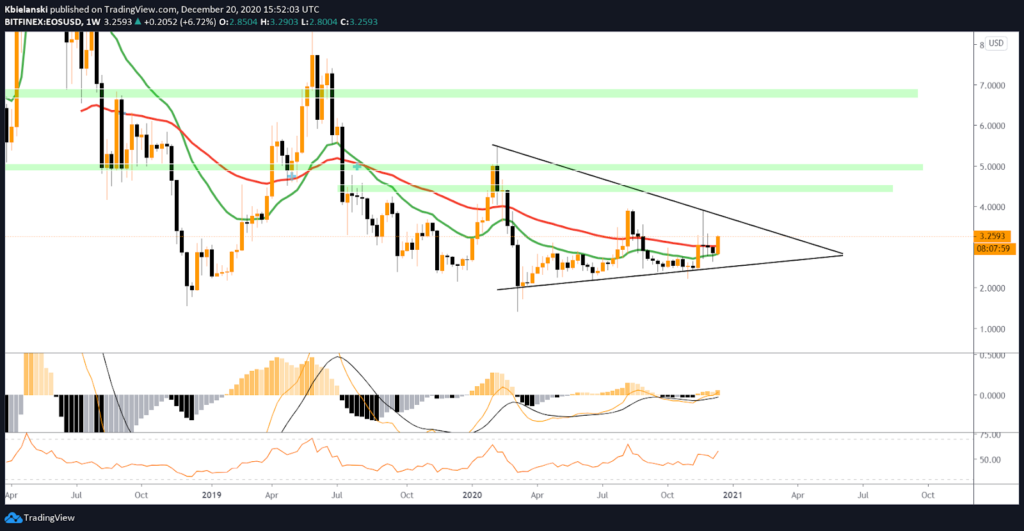
The Relative Strength Index (RSI), which indicates EOS’s strength, is trading at 61.88, and it is heading towards the overbought zone. Indicates the bullish momentum in the coming trading sessions.

Moving Average Convergence Divergence (MACD) currently indicates the bullish trend on the daily chart as it gives a positive crossover with the significance of Bull’s line (yellow) over Bear’s line (black) with no sign of weakness.
The EMA is not given any positive crossover, so more confirmation is required for bullish momentum.
Support levels: $2.45 and $2.20
Resistance levels: $3.35 and $3.95


