
 Home
Home News
News

- Ethereum Classic / Dollar (ETCUSD) gave a breakout on January 3,2020. ETCUSD was trading around $5 on new year’s eve and reached to the LTP of $7.090 within 5 days.
- However ETC/USD is expected to take a breather now.
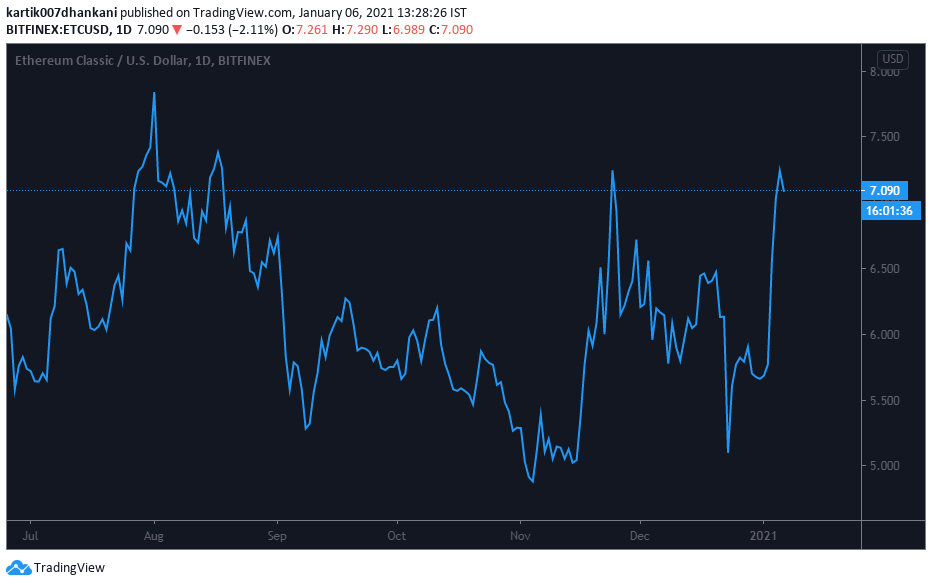

On the line chart one can easily spot a long term sideways channel with a support zone of $4.8-$5 and a resistance zone of $7.5-$8.0. The one month long bear run ended with the end of 2020 and the coin touched the top of November within 5 days i.e. $7.090. A further upwards movement will get hurdles at &7.8-$8.00 levels.

The Inverted Head And Shoulders Of ETC Price
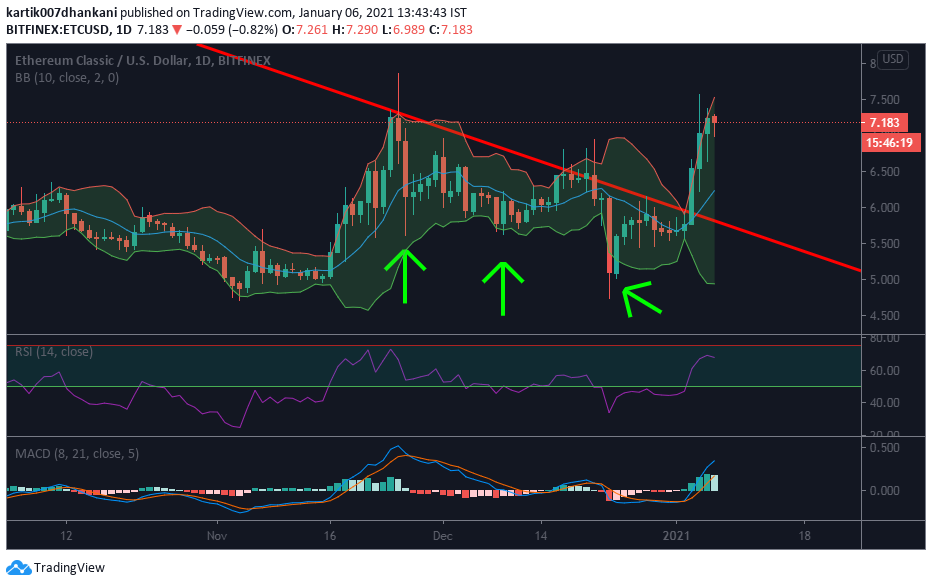
ETCUSD was creating a rare pattern on its journey to test supports of November i.e. $5.00. On its way down, Etherum tested its resistance line (red colour) thrice and made three different bottoms every time it couldn’t sustain the levels. The bottoms turned out to be the inverted Head and shoulder pattern which are not as common as the triangular breakout. The head and shoulders are shown with green arrows.
On new year’s eve, ETCUSD finally broke the monthly resistance and gave an upside movement of 13.51% which was accompanied by the widening of Bollinger Bands(10 SMA) which gave a confirmation of increased volatility. The coin rode the upper band for three days but by the third day gave longer wicks and a smaller body on the daily candle pointing towards weakness in the rally.
The MACD(8, 21, 5) also gave a cross over from the support levels of -0.115 and are now headed to test the 0.43 levels made during November 2020. However a divergence is spotted this morning which indicates weakness. Also one can spot that the volume also decreased this morning and broke the three day streak.
The RSI(14) left the neutral territory of 50 levels along with the breakout and headed to the oversold territory at the 75 levels. This morning due to some profit booking making the trend weaker which made RSI return from 73 levels without testing the 75 levels. The RSI will now get support at 60-61 levels.
CONCLUSION
The bulls seem to take a breather as this morning Ethereum Classic / Dollar failed to continue its three day streak of green candles which increased the possibility of sideways or downward movement as compared to a further upward movement. The coin is at the resistance level on i.e. $7.25, sustaining which it will continue the journey to test $8.00 or else will retest the support levels of $6.500.
Resistance Level: $7.25
Support Level: $6.500


