
 Home
Home News
News

- NEOUSD was in a bear run till it gave a breakout on January 3, 2020.
- NEOUSD was in a bear run from December 17 2020 till January 3,2021and rose from $14.42 to LTP $17.38, a 20.8% run.
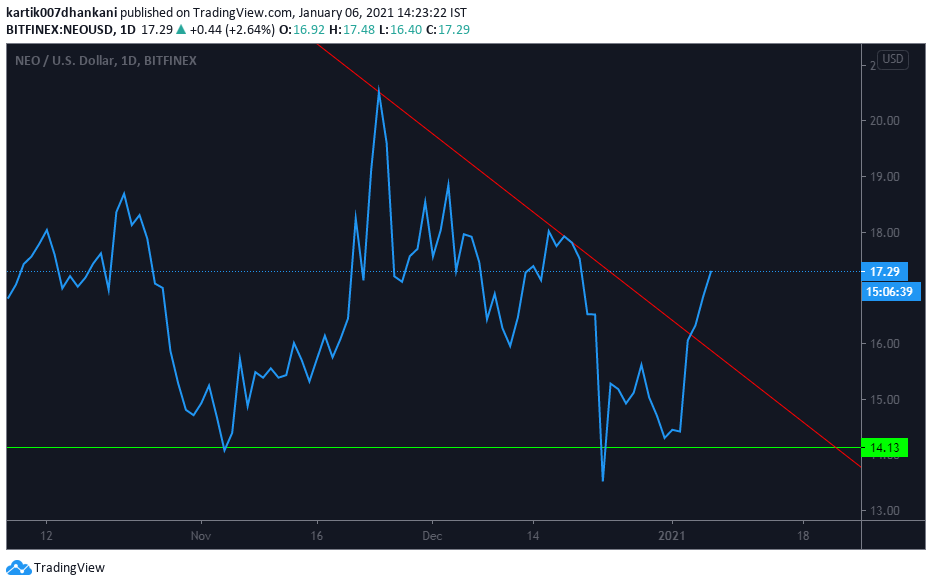

From the line chart analysis, we can spot a triangle pattern breakout composed of a two-week resistance level and a strong monthly support level($14.13-$14.20). The script gave a breakout on January 3 and is currently trading at $17.16. The next resistance is expected at $18.25 and $20.00. The immediate support is $16.00. The 24 hour volume and market cap are $180,247,802 and $1,211,810,064 respectively.

CAN NEO BULLS BREAK THE SECOND TRIANGLE?
On the technical charts, by joining the three highs made on September 18, 2020, November 25, 2020, and December 19, 2020, we will get a long term resistance line which is forming a triangle pattern with support lines at $16.25-$16.30 level and $14.00 levels. It seems that this resistance line is the reason why the three-day rally of NEO/USD got interrupted.
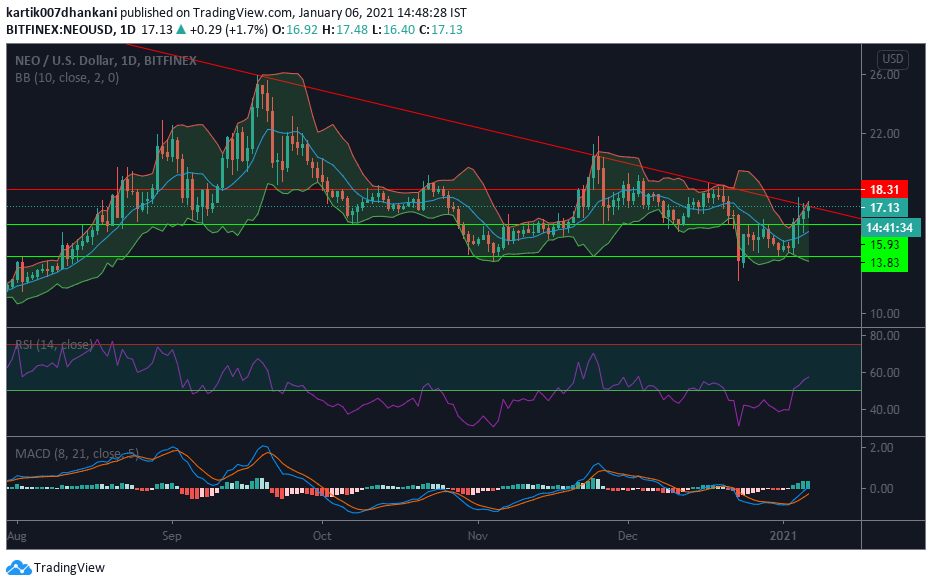
Bollinger Bands(10 SMA) indicates the success of the breakout as the volatility increased simultaneously. Due to the breakout, the coin is now trading above 10 SMA which depicts the onset of a bull run.
RSI(14) came from the oversold territory to the neutral territory while the coin was in consolidation and then entered into the bullish zone(above 50) at the time of breakout. The signal line is facing resistance at 55-60 levels; a further upwards movement can be a confirmation of the triangle breakout. The next resistance is expected at 63-65 zone.
The MACD(8, 21, 5) confirmed the breakout by giving a bearish crossover and preparing to leave the negative territory. MACD lines are currently at -0.09 and 0-0.1 and might face resistance at 0 levels and 0.5 levels. If the MACD line enters the positive territory at the time of breakout, it can result in another bull run.
CONCLUSION
NEO/USD has already given a breakout from a smaller triangle but faces resistance from a long term resistance line. If the coin sustains this level, it might give another triangle breakout and move ahead from the current $17.09 towards the levels of $18.30-$19.00 and then $20.50-$21.50 levels. A decline from the current level may make the coin test its immediate support at $16.35 and $15.00.


