
 Home
Home News
News

- After touching the critical support area around $85.00, Dash Coin price was able to bounce back strongly from the past couple of trading sessions
- During the current market session, the price level looked for a positive breakout above the crucial mark of $100.00
- The DASH/BTC pair is also performing significantly positive with an overall gain of 5.98% bringing the current level to 0.002604 BTC
Dash Coin Price Looking To Regain Bullish Levels Above $100
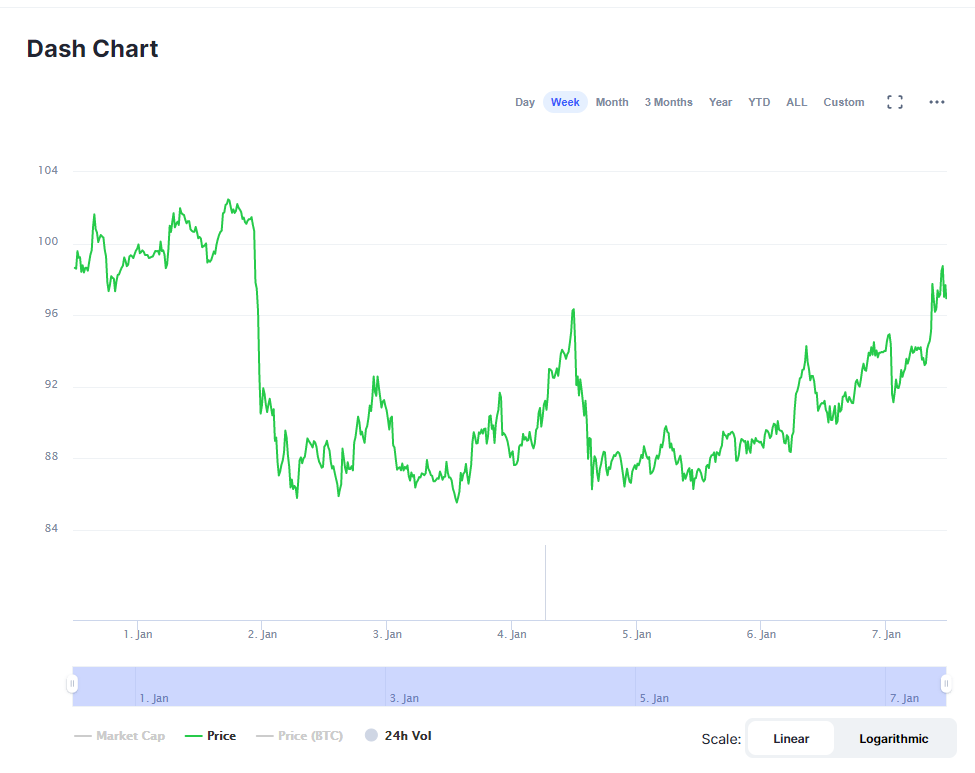
The weekly price performance chart of Dash coin price highlights the sharp bearish divergence faced by the price levels after a negative breakout below the crucial mark of $100.00 resulting in the testing of the critical support area of $85.00. The support point did provide a positive bounceback to the crypto asset, meanwhile, the emergence of the bulls in the altcoin segment helped the price level to have a positive breakout above the minor resistance level of $92.00. During the current market period, Dash targetted the crucial bullish mark of $100.00 with moderate signs of retracement from the price level of $98.00.

The CMP is placed at $97.23 with an overall gain of 6.70% bringing the market capitalization to $969,274,199 resulting in an increase of 7.38%. The 24-hour volume traded has reached $919,847,819 with an incline of 23.21%.

Dash Coin Forms Rising Channel Pattern On Technical Chart
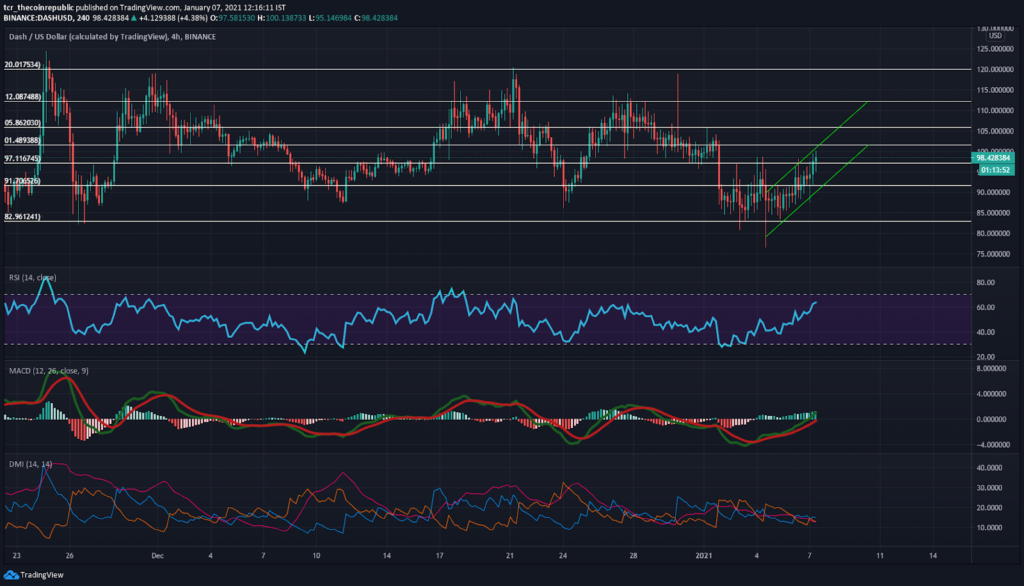
The technical chart of Dash resembles the retracements faced by the price levels at regular intervals while facing major resistance at 0.786fib level. After touching the critical support level of $85.00 residing at the neutral line of the retracement table, the price levels have bounced back positively forming a rising channel pattern. A positive crossover above the 0.786fib level can surely be a bullish indication for the upcoming trading sessions.
The relative strength index (RSI) is showcasing positive nature while standing at 55.82, targeting the overbought territory.
The moving average convergence & divergence (MACD) has formed a bullish crossover below the signal line and looked to gain further positive levels on the chart.
The directional movement index (DMI) is showcasing sideways nature as ADX and -DI levels got consolidated with each other on the chart.
Resistance level: $98.00 & $100.00
Support level: $90.00 & $85.00
Mr. Pratik chadhokar is an Indian Forex, Cryptocurrencies and Financial Market Advisor and analyst with a background in IT and Financial market Strategist. He specialises in market strategies and technical analysis and has spent over a year as a financial markets contributor and observer. He possesses strong technical analytical skills and is well known for his entertaining and informative analysis of the Financial markets.


