
 Home
Home News
News

- The overall bearish trend in the crypto market has provided significant damage to XTZ price levels
- The crypto asset faced heavy downfall measuring around 13.00% during the current market session
- The XTZ/BTC pair also turned negative with a loss of -12.85% bringing the current level to 0.00006837 BTC
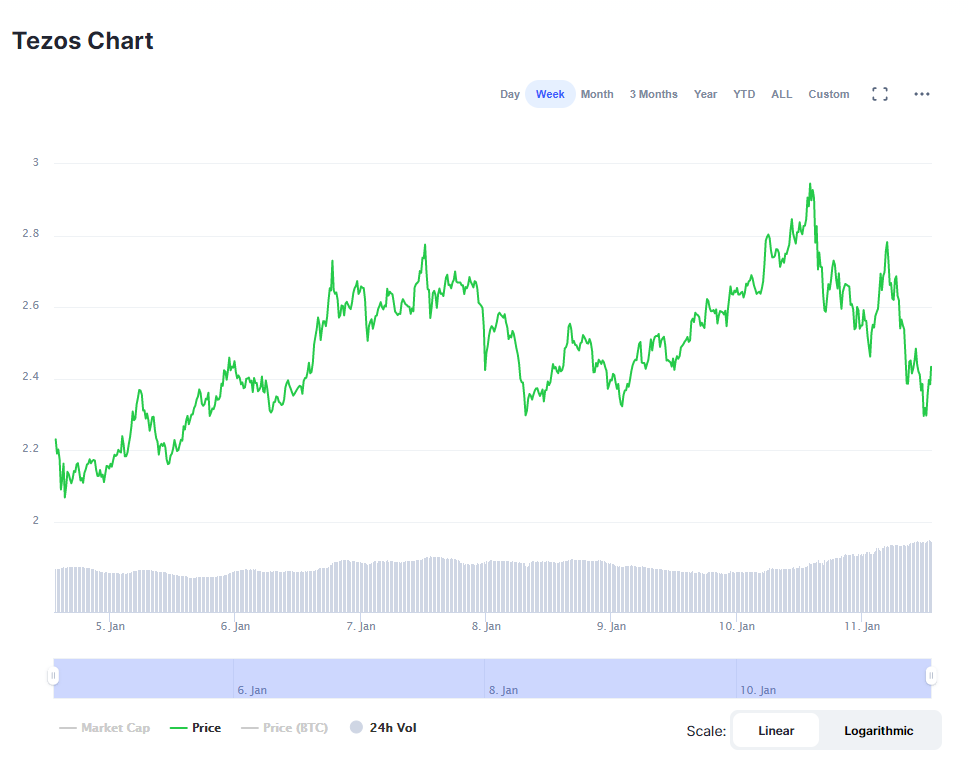
The weekly price performance chart of XTZ price levels reflects on the gradual positive momentum built, which resulted in testing the significant resistance level of $3.00. The resistance level provided significant negative reversals to the price levels making lower highs at the end of the chart and reaching the support region around $2.40 during the current market session. The CMP is placed at $2.39 with an overall loss of 13.00%, bringing the market capitalization to $1,823,360,351, resulting in a loss of -11.25%. The 24-hour volume traded has reached $590,138,587, causing an incline of 34.42% reflecting on the crypto asset’s selling pressure. The price levels have registered a 24-hour low of $2.29, and a negative breakout below the level can be a bearish indication for the upcoming market session.

XTZ Price Levels Slips Below Bullish Regime On Technical Chart
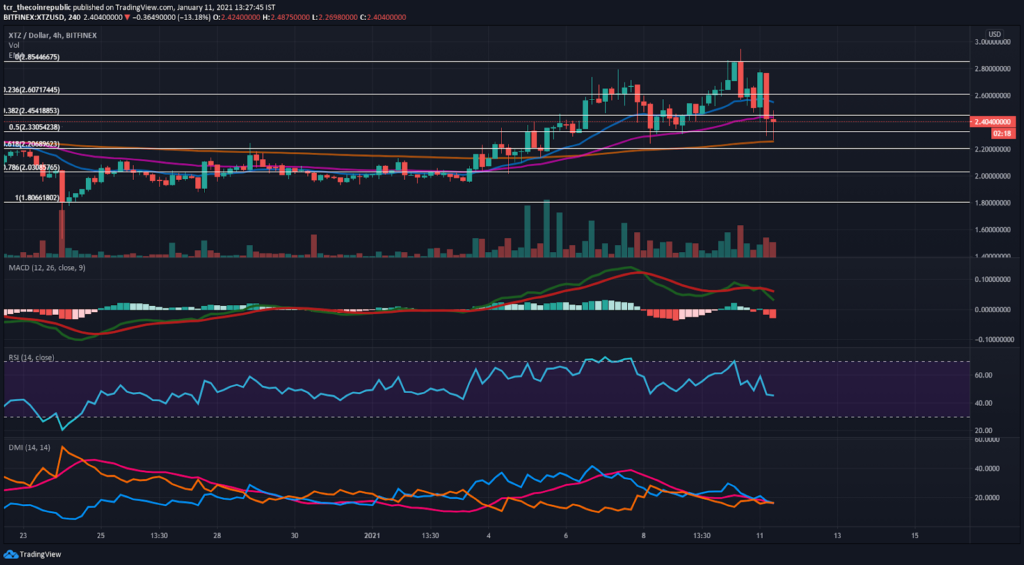
The technical chart of XTZ price focuses on the gradual positive momentum, which resulted in the testing of critical resistance present at $3.00. The resistance level provided significant bearish reversals which resulted in a negative breakout below the 0.382fib level. The price levels have also suffered negative breakout against 20-EMA and 50-EMA respectively. If the downtrend continues further, it is expected to found support at 200-EMA.

The moving average & convergence (MACD) also faced a bearish crossover and looked vulnerable to go below the signal line.
The relative strength index (RSI) has retraced back from the bullish regime while standing at 42.35.
The directional movement index (DMI) has also consolidated wherein ADX looked vulnerable for a negative crossover against -DI.
Resistance Level: $3.00
Support Level: $2.20 & $2.00
Mr. Pratik chadhokar is an Indian Forex, Cryptocurrencies and Financial Market Advisor and analyst with a background in IT and Financial market Strategist. He specialises in market strategies and technical analysis and has spent over a year as a financial markets contributor and observer. He possesses strong technical analytical skills and is well known for his entertaining and informative analysis of the Financial markets.


