
 Home
Home News
News

- XRP is trading flat on a medium-term chart while rising its support line; furthermore, the volume is not sufficient for a bullish momentum, though a sideways trend is expected in short term
- The XRP/BTC pair is trading at 0.00000833 BTC with a marginal gain of +2.01%
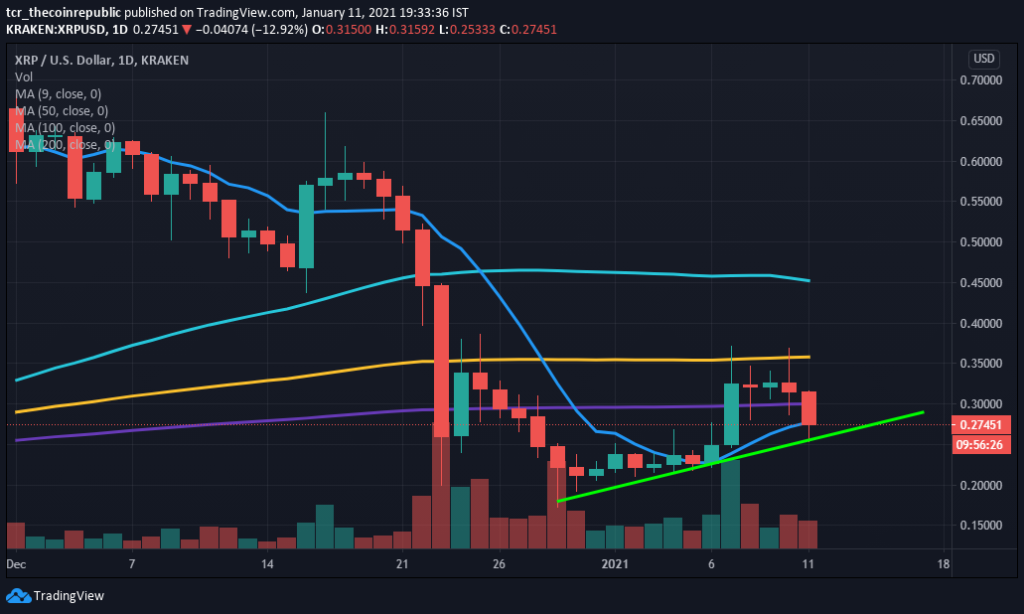
XRP price plunged over -17.12% in last 24-hour. However, the primary support level is still respected by $0.24. The ripple coin chart indicates a bullish momentum as it started to trade on the higher side. The 9-Day Moving Average is currently heading towards the higher region. Likewise, it is currently facing the resistance of 100 and 50-DMA. A crossover of 9-DMA over 200-DMA can generate a bullish momentum in upcoming trading sessions. The key levels to watch are $0.24 and $0.18 acting as support on the lower side and similarly on higher side resistance can be considered at $0.32 and $0.44.

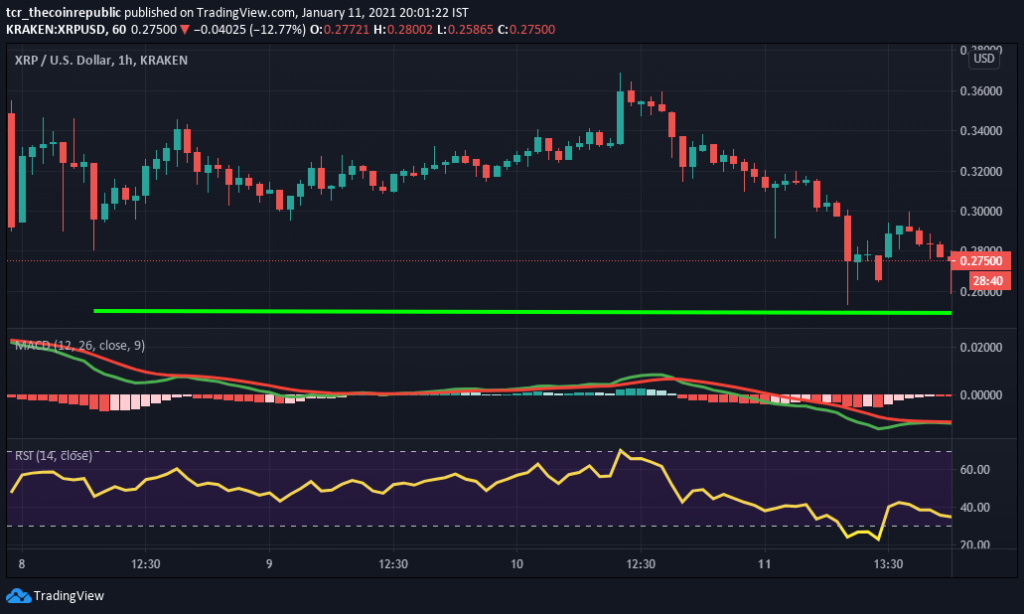
XRP Price on the daily chart was trading on bearish trend and tested the lower levels $0.26 and gained back from lower levels. The volume traded in last 24-hour is $9,770,309,134, which jumps over +12.61% and the market capitalization stands at $12,573,930,471 dropping over -18.06% in intraday. The support on the daily chart is situated at $0.25 and $0.23. Likewise, resistance on the higher side is placed at $0.28 and $0.30.

The Relative Strength Index (RSI) indicates a bearish momentum while trading at 36.30, which is placed near oversold territory. Therefore, it can expect a short-term bounce in upcoming trading sessions.
Moving Average Convergence Divergence (MACD) currently indicates a bearish trend on the daily chart as it gives a negative crossover. The significance of the selling line (red) over buying signal lines (green)is high. However, a positive crossover is expected as both lines are heading closer to each other.
Support levels: $0.24 and $0.18
Resistance levels: $0.32 and $0.44
Mr. Pratik chadhokar is an Indian Forex, Cryptocurrencies and Financial Market Advisor and analyst with a background in IT and Financial market Strategist. He specialises in market strategies and technical analysis and has spent over a year as a financial markets contributor and observer. He possesses strong technical analytical skills and is well known for his entertaining and informative analysis of the Financial markets.


