
 Home
Home News
News

- TRX/USD (Tron) is in a bear run from the past two sessions, after getting rejected from the highs of November 2020.
- TRX/USD (Tron) has seen some fresh buying in the last session
- TRX/USD (Tron) is preparing for a breakout from a symmetrical triangle.
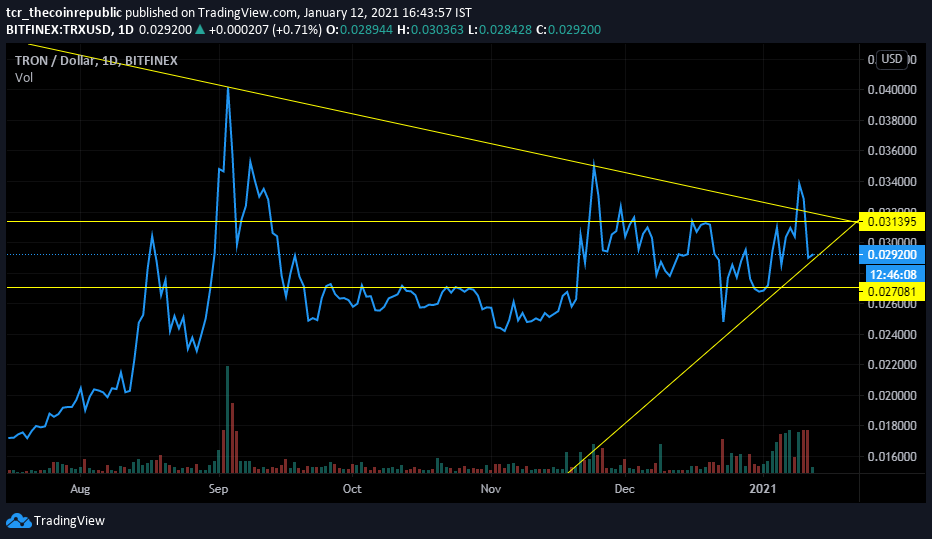
Tron (TRX/USD) has made a big symmetrical triangle on the daily charts which made a whipsaw a few days back indicating a potential resistance at $0.034 levels. Currently the coin is at $0.0292 and has seen some fresh buying as indicated by the green volume stick at the bottom of the picture. The coin has increased volatility accompanied by huge volume which is required for a major movement either side. The 24 hour volume and market cap are $533,684,829 and $2,104,462,226 respectively.

A Silver Lining after the thunderstorm of Bears For Tron: The Green Doji
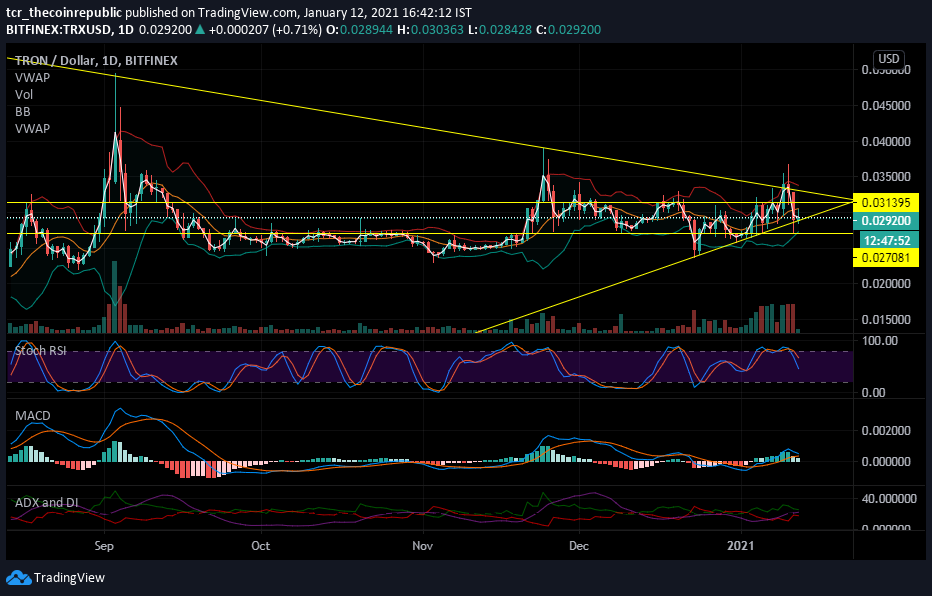
Tron (TRX/USD) was heading for a potential breakout a week back which got smashed by bears residing along the line of a long term resistance, causing the coin to sink 15% within three days. However the Bulls came in action from the previous support levels and made a tiny Doji candle in today’s session. The candle is signalling indecisiveness so far and making the traders wait for any further buying and selling to decide the course of this rally.

The Bollinger Bands have contracted today, signaling lower volatility from both sides. The Coin is below the median which is signalling bearish momentum. The median rest at $0.0282 which will act as resistance for the coin. COin needs to surge above that to commence an uptrend.
The VWAP rests at 0.029338, a crucial resistance or support zone for any script. Right now it is a resistance.
The Stochastic RSI has given a sell signal and is in neutral territory signalling a trend in the existing bearish trend. The stochastic may take support from 40 levels to signal a reversal.
The MACD showed weakness in the bull run by reversing the divergence in the signal and slow line. If the MACD gives a sell signal it will increase probability of a breakdown for the coin.
He ADX has neutralised at 21.95, which is a weak trend supporting the point of indecisiveness in the market. If the Green line(ADX+) goes beyond 25 level, it will signal a strong bullish momentum which can be used as a buying signal or vice versa if thered line (ADX-) will crop 25 levels.
Conclusion –
TRON (TRX/USD) is resting at support level of 0.0288. A fresh buying or fresh selling will only initiate a breakout or breakdown respectively.
Resistance: $0.0293(VWAP) , 0.03(Median of BB) and 0.0313(resistance line)
Support: $0.0287(support line) and $0.0272(lower BB and support line)


