
 Home
Home News
News

- XRP price after creating the double top pattern slips down; however, a positive rally pushes it to higher levels again, but the indicators are not in support for this movement
- The XRP/BTC pair is trading with a minor gain of +0.21% in last 24-hour standing at 0.00000882 BTC
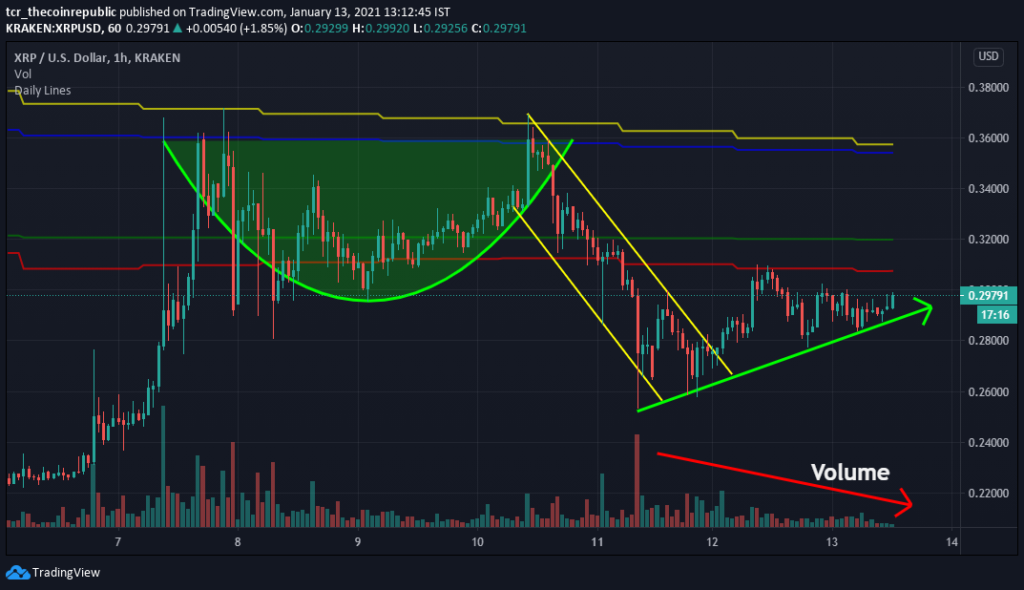
XRP Price was trading on a bullish note after testing the higher level of $0.3650 twice, and it made a double top pattern. The digital asset is currently trading at the price levels of $0.2992 with a loss of -2.96% in the last 24-hour. The rising support line in XRP follows the slow recovery from the lower levels of $0.2478. It is currently trading below all major moving averages of 20, 50, 100 and 200-Day and now facing the resistance of 20 and 200-DMAs. The volume in the uptrend is declining while indicating the divergence against the asset movement. The support levels on the downside are placed at $0.24 and $0.18. Similarly, resistance on the higher side is situated at $0.32 and $0.39.

On the daily chart, XRP price is trading with higher highs, and lower lows while indicating a bullish trend. XRP price is currently trading at $0.2992 with intraday marginal loss of -2.96%. The volume recorded in the last 24-hour period is $6,324,205,143 with a significant fall of -31.21%. Likewise, the market capitalization stands at $13,584,240,620, which drops over -2.77% today. The daily chart support can be considered $0.27 and $0.25, and on the higher side resistance is placed at $0.32 and $0.34.

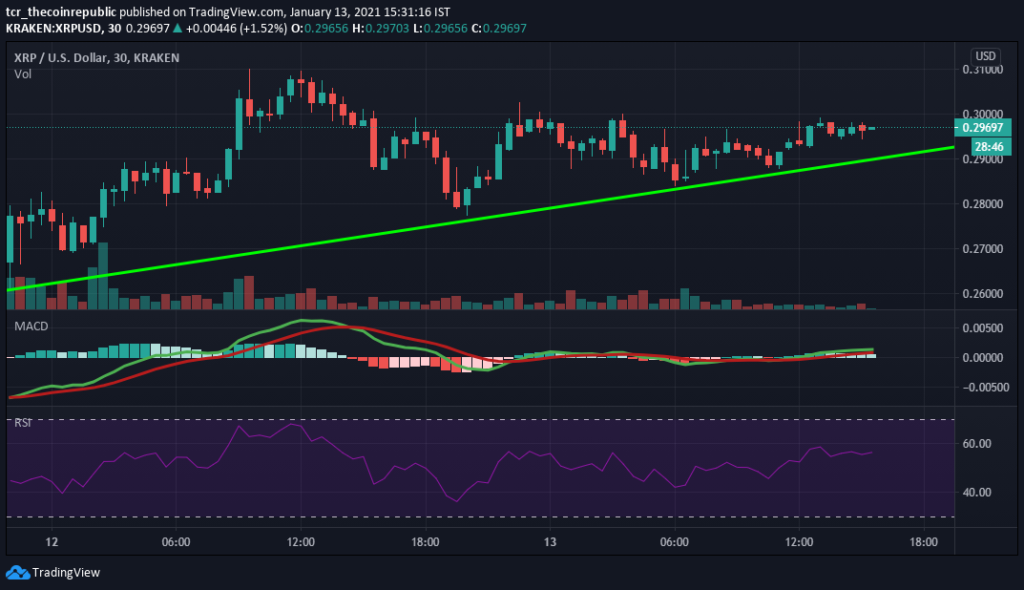
The Relative Strength Index (RSI) indicates a bullish momentum while trading at 60.97. Currently, it is heading towards the overbought territory.
Moving Average Convergence Divergence (MACD) currently indicates a bullish trend on the daily chart as it gives a positive crossover with the significance buying signal line (green) overselling line (red). However, both the lines are trading closer to each other and can negatively affect the short term.
Support levels: $0.24 and $0.18
Resistance levels: $0.32 and $0.39.
Mr. Pratik chadhokar is an Indian Forex, Cryptocurrencies and Financial Market Advisor and analyst with a background in IT and Financial market Strategist. He specialises in market strategies and technical analysis and has spent over a year as a financial markets contributor and observer. He possesses strong technical analytical skills and is well known for his entertaining and informative analysis of the Financial markets.


