
 Home
Home News
News

- Ethereum price levels had a bullish rally during the current market session with positive sentiments prevailing in the overall market conditions
- Ether current price also had a positive breakout above the crucial resistance mark of $1150
- Due to the fresh upsurge, the weekly loss for ether is now reduced to 3.33% only
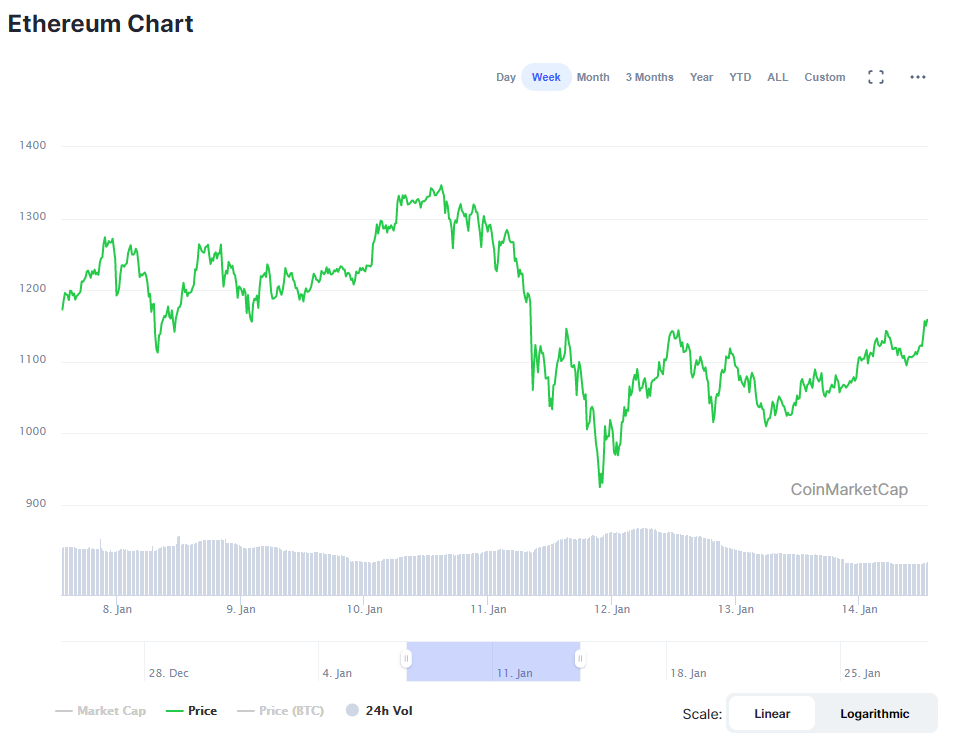
The weekly chart of Ethereum highlights the significant bearish momentum faced by the price levels after testing the critical resistance mark of $1350.00 during the bull run. The negative retracement forced the price levels to test the major support level of $950.00 which helped the world’s second-largest crypto asset to regain its positive momentum. During the current market session, Ether had a positive breakout above the resistance mark of $1150.00 indicating that the digital asset is looking to regain its bullish regime. Ether current price is at $1158.69 with an overall gain of 7.67% bringing the market capitalization to $132,423,317,786 causing a fresh surge of 8.70%. The 24-hour volume has reached $30,091,077,490 resulting in a decline of 18.64%.

Ether Current Price Breaks Above First Resistance Line

The technical chart of Ethereum highlights the significant price damage faced by the bulls which were eventually ended after the price levels tested the major support zone around $950.00. The positive momentum provided from the support zone has provided a positive breakout above the first resistance line placed around $1150.00 during the current market session. If the price levels are able to maintain sustainability above the first resistance line, we may expect ether to test the second resistance line placed around $1270.00. Also, if 20-EMA is able to cross above the first resistance line, the price levels would be having the support to test the second resistance line too.

The relative strength index (RSI) looked in the potential to have a positive breakout to the oversold region while standing at 66.19
The moving average convergence & divergence (MACD) had a bullish crossover above the histogram line showcasing positive nature.
Resistance Line: $1150.00 & $1275.00
Support Line: $1030.00 & $950.00
Mr. Pratik chadhokar is an Indian Forex, Cryptocurrencies and Financial Market Advisor and analyst with a background in IT and Financial market Strategist. He specialises in market strategies and technical analysis and has spent over a year as a financial markets contributor and observer. He possesses strong technical analytical skills and is well known for his entertaining and informative analysis of the Financial markets.


