
 Home
Home News
News
- Cosmos price levels have been on a bullish trend since the starting of the year
- The ATOM/BTC pair performed negatively during the current market session with an overall loss of -2.35% bringing the current level to 0.0002562 BTC
- Cosmos has been relatively compared to Polkadot due to its similar use-case in the blockchain industry
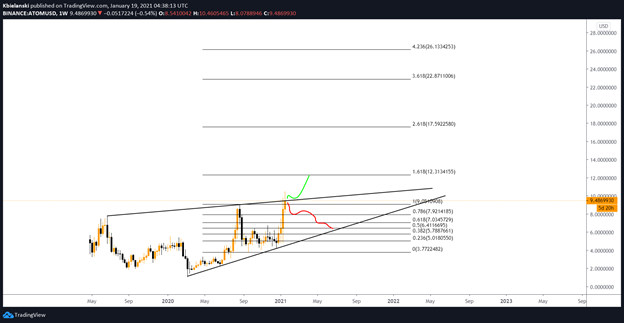
The technical chart of Comos (ATOM) highlights the price action since its inception and forming a symmetrical triangular pattern on the chart. Since the starting of the current year, the price momentum has been significantly bullish starting around the price level of $6.00 to testing the critical resistance mark of $10.00. During the current market session, the cryptocurrency faced negative reversals from the resistance mark resulting in a loss of -2.27% and bringing the CMP to $9.06. The market capitalization has reached $1,878,515,324 causing a decline of 5.48% with the 24-hour volume traded reaching $735,951,418 resulting in a loss of 26.17%.

Cosmos’s usage and model has been relatively compared to the Polkadot ecosystem as its aim is to make blockchain technology less complex and bringing simplicity for developers with its modular framework. Just like Polkadot’s parachains framework aims to connect and simplify dapps in DeFi, Cosmos’s inter blockchain communication protocol also provides means to establish simplified communication for blockchain networks with each other.

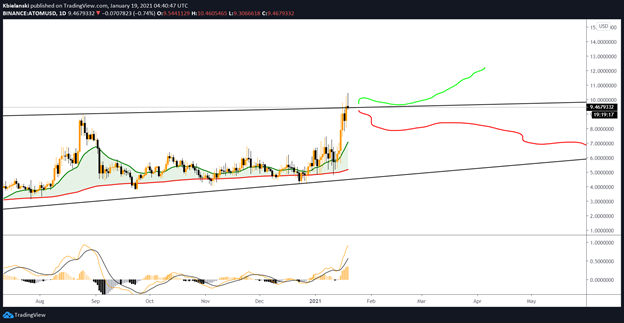
The price levels are testing the upper range of the rising channel pattern from the past couple of trading sessions and facing moderate corrections. A positive breakout from the channel will help Cosmos to discover new bullish regimes on the chart. On the contrary, a negative breakout will bring the major support level placed at $6.80 into the play. The moving average convergence & divergence (MACD) is showcasing positive nature on the chart after having a bullish crossover and showing no signs of retracement. On the weekly timeframe, RSI is placed at 74.00 indicating more potential upside to come for Comos in the upcoming market sessions.


