
 Home
Home News
News

- Stratis coin is building ascending triangle pattern on the weekly chart and facing strong resistance
- The STRAX/BTC pair is trading at 0.00001528 BTC with an intraday drop of -5.53%
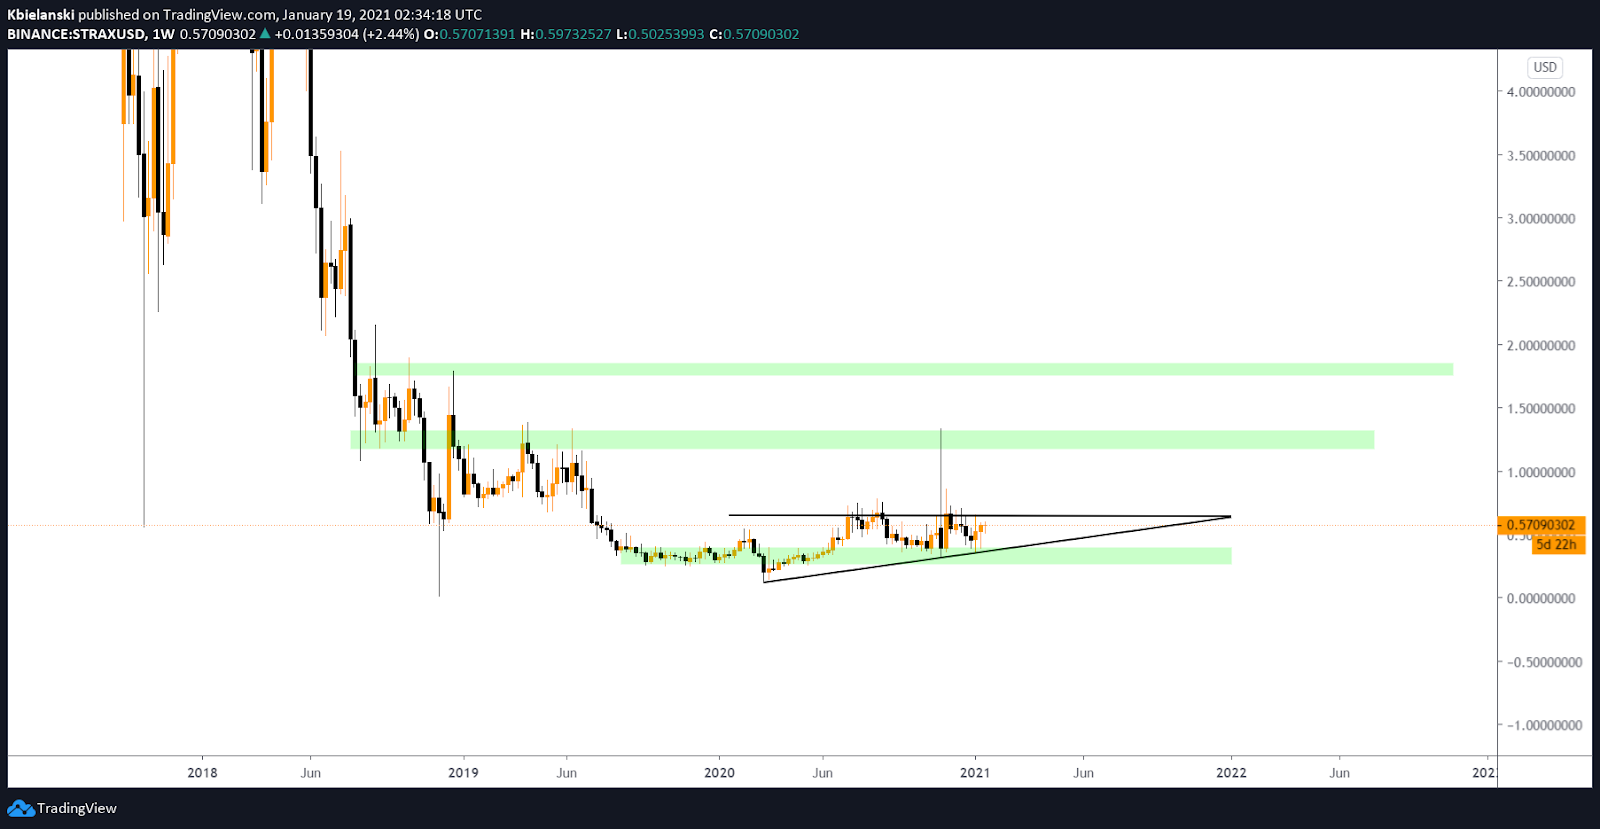
Stratis (STRAX) coin is trading in the resistance zone of ascending triangle pattern. The coin will break the pattern in, and the breakout can give the targets of $0.95 and $1.20 in the upcoming trading sessions, while support on lower levels is placed at $0.44 and $0.35.

The critical resistance on higher levels is placed at $0.65 and $0.85. The coin is still far from the all-time high of $22.66, recorded on January 08, 2018. However, STRAX also gave a massive return of +6141% from the all-time low of $0.008483.

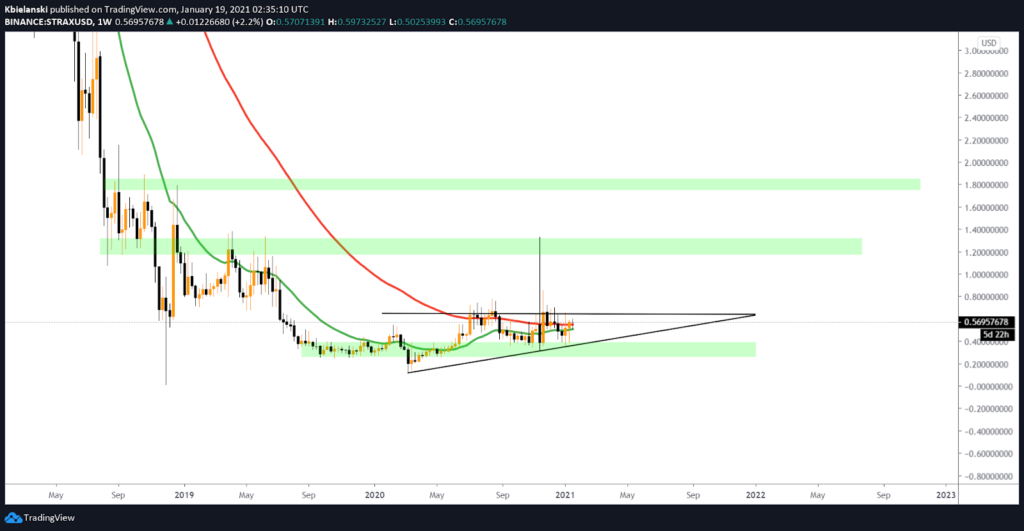
The EMA of STRAX heads closer to each other but it does not reflect any sign of positive crossover. The key level to watch on the lower side is $0.40. Similarly, the resistance on the higher side is placed at $1.15 and $1.85.
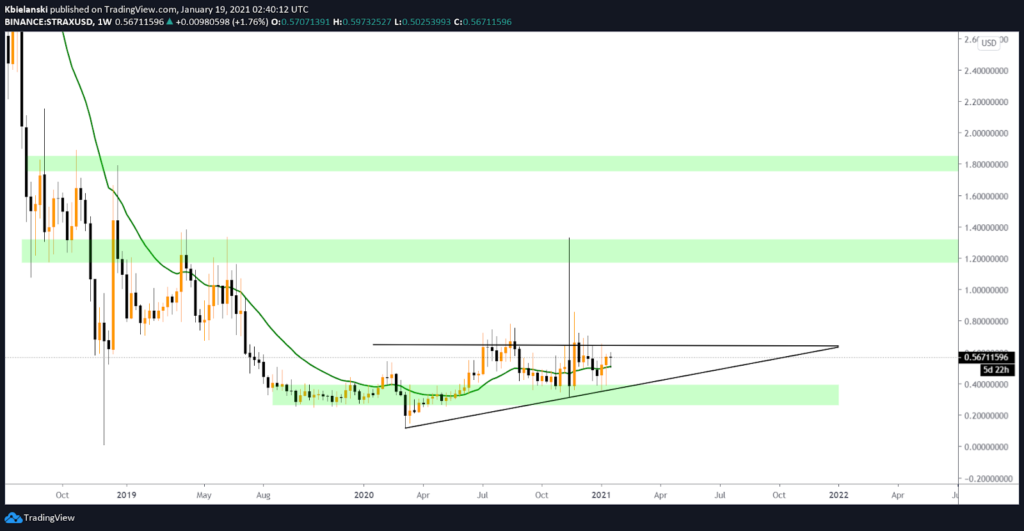
STRAX is trading at the price level of $0.5243 with an intraday loss of -13.29%. The volume recorded in the last 24-hour time frame jumped over +110.48%, standing at $3,938,862. Meanwhile, the market capitalization stands at $52,987,761, with a drop of -13.07%. Presently 20-EMA is acting as support on the weekly chart.
Relative Strength Index (Bearish) indicates a bearish momentum while trading at 52.77 and is currently heading towards the oversold region after testing the overbought.
Moving Average Convergence Divergence (mixed) currently indicates a mixed signal on the weekly chart as it gives a negative crossover with the significance of the selling line (red) over buying signal line (green).
Support levels: $0.44 and $0.35
Resistance levels: $0.65 and $0.85


