
 Home
Home News
News

- Bitcoin Cash Value performs in negative momentum in Friday’s trading session
- Bitcoin Cash Value is currently at $425.96, which is down by 7.42% in last the 24 hours and 15.84% down from the previous week
- BCH/BTC pair also performs negative with a loss of 0.10% in Friday’s trading session (0.013556)
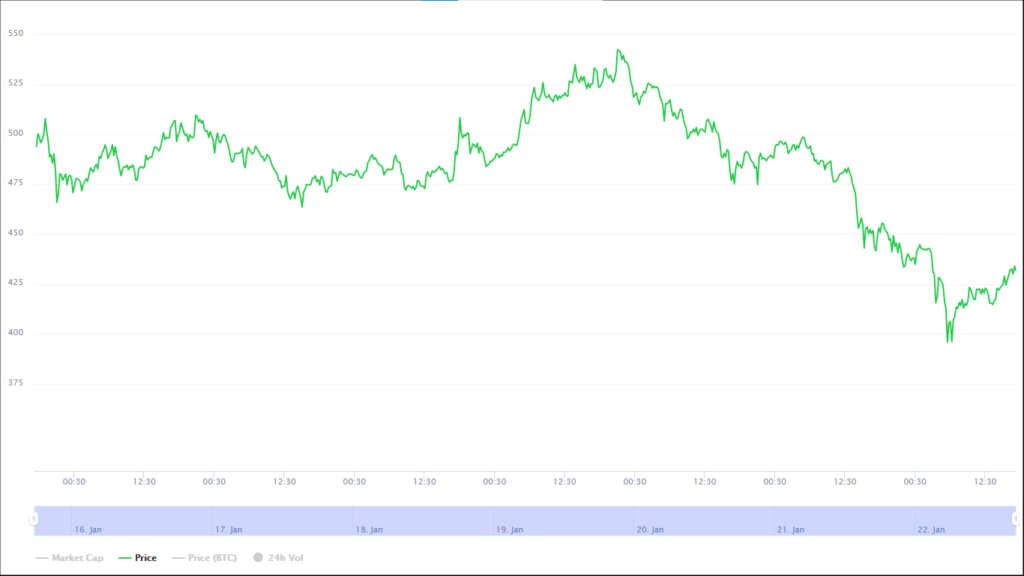
Bitcoin Cash Value had negative momentum on the weekly chart and went up to $629.80 on January 10, 2021, by breaking above the resistance zones created in the past. BCH price set up a mark of 52-weeks high with the help of overall market conditions. The BCH/ETH pair is in a downtrend with a value of 3.56% in Friday’s trading session (0.3626).

Bitcoin Cash Technical Chart Indicates Bearish Behaviour
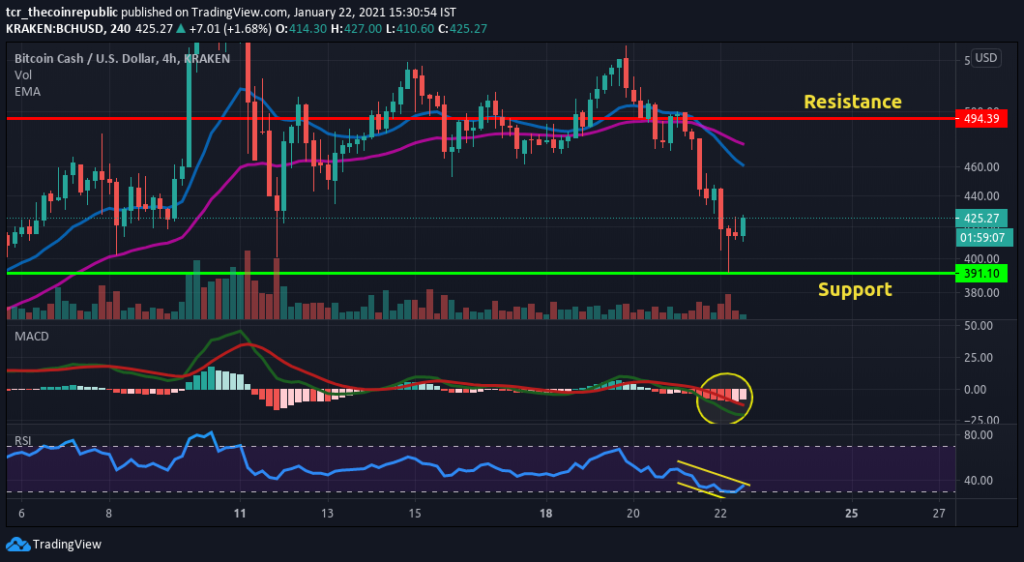
The daily technical chart of Bitcoin Cash value highlights a negative trend due to overall market conditions on Friday’s trading session. The price is currently sitting at $428.55, with a resistance zone of $494.39, following the support zone of $391.10. On diving into the weekly chart of a 30-minute time frame, it formed a three outside down candlestick pattern. Indicating a sell signal in the coin.

If we look at 20 & 50 days, the exponential moving average (EMA), 20 EMA (blue line) is at $461.05, and 50 EMA (purple line) is $476.00. The price is below both the EMA one can expect a bearish trend in the coin for the next few trading sessions.
The Volume indicator of value (929) reflects a deficient buying volume in the coin with the overall market’s condition. We can further see a decrease in volume in Friday’s trading session.
MACD indicator (Bearish) one cannot observe any bullish crossover on the signal line on January 22, 2021, during the trading session. This indicates a sell signal in the coin and also observes massive red bars in the Histogram.
Meanwhile, the RSI indicator (Bearish) with a value of 35 indicates a sell signal in the coin. It may soon move towards the oversold territory in upcoming trading sessions if the selling continues further.
Conclusion
Bitcoin Cash Value is down by 7.42% on Friday’s trading session. The price is below 20 and 50 days EMA, and it can move towards the support level of $391. One can further expect a short term recovery in the coin for a while, and then it can be bearish in the upcoming trading session.
Resistance: $494.39
Support: $391.10
Mr, Nikhil Ingole is a Chief Editor at The Coin Republic with over five years of technical analysis & trading experience in Forex and Crypto. As a commerce graduate, he has taken a keen interest in blockchain’s future potentials in the financial industry. A keen cryptocurrency enthusiast, he is very supportive of new media projects, pioneer ideas and the Bitcoin community. He possesses strong technical, analytical skills and is well known for his financial market’s informative analysis. Other than crypto, Nikhil Loves to watch his favorite football team and keep up to date with the latest Formula 1 racing.


