
 Home
Home News
News

- XLM prices which zoomed 220% before plummeting by 40%, is probably preparing for a 118% rise
- XLM prices made a lag and pole pattern due to the profit booking
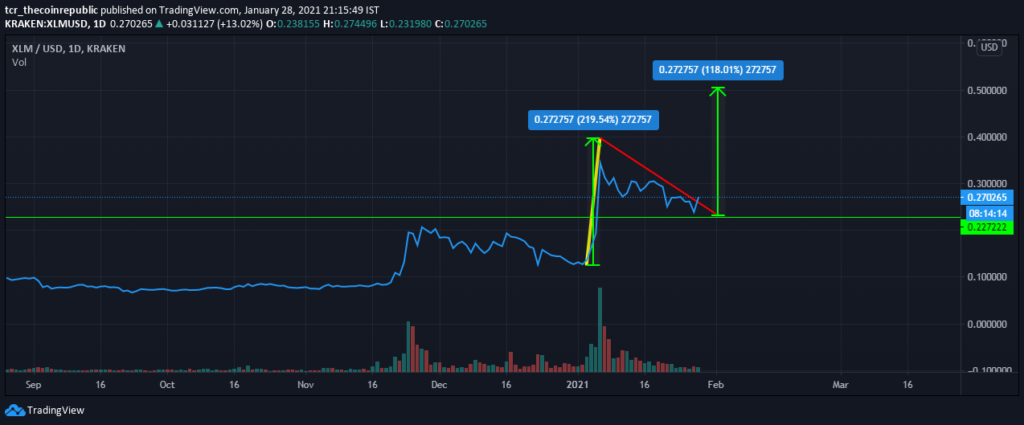
Stellar Lumens’ prices made a flag and pole pattern, with a pole of $0.2727; this means that a successful breakout can launch the coin by $0.2727. COnsidering the above statements and the recent buying in the coin, the coin can surge by 118% from current levels. The market cap and 24 hour volume of the coin are $5,948,993,556 and $389,524,474 respectively.

Stellar Lumens’ Flag Pattern May Surge The Coin By 120%
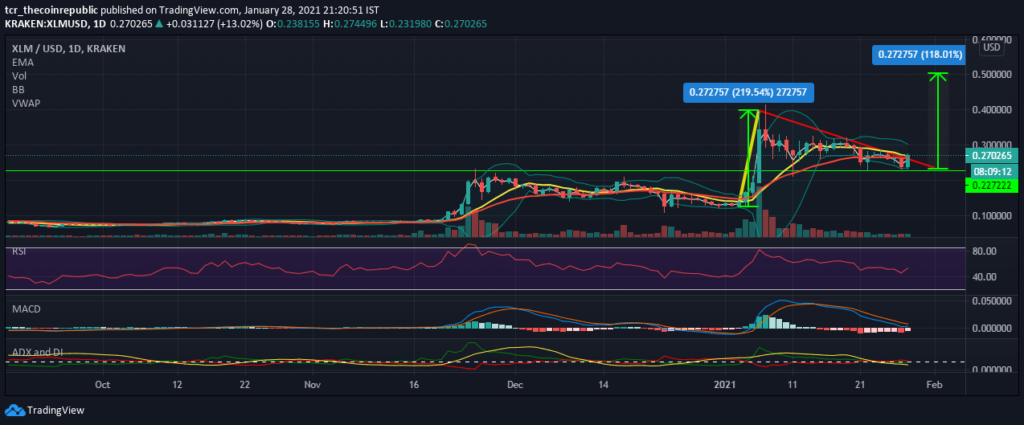
Stellar Lumens’ prices are taking support from the previous high of $0.2272 while taking resistance from a diagonal resistance, resulting in a flag pattern. The coin’s price is also taking support from the 50EMA($0.2278).

The prices are facing support from VWAP $0.2589 and resistance from 20EMA and 10EMA at $0.263 and $0.268 respectively.
The Bollinger Bands have contracted due to the consolidation of prices between the support and resistance. The upper band and median(10 EMA0 are acting as resistance at $0.30 and $0.268 respectively, while the lower band is acting as a support at $0.235.
The RSI has crossed 50 levels and is hovering at 53 levels currently.
The MACD(8,21,5) shows a change in the direction of the fast line which was falling from a very long time, it seems as if the fast line may cross over the slow line along with the breakout; bringing in a higher buying pressure.
The ADX line is at 12.55 while the DI+ and DI- lines are at 22.5 and 18.71 respectively. SO far the buying pressure is exceeding the selling pressure, but accompanied with consolidation.
Conclusion –
Stellar Lumens’ price has reached to the pivot of the flag of a flag and pole pattern which may throw the coin to 100% up till $0.40. A decline from this level can reduce the coin $0.20.
Support: $0.227(50 EMA and previous high)
Resistance: $0.2635(20 EMA) and $0.27(10 EMA)


