
 Home
Home News
News

- Compound performed a positive momentum on Monday’s trading session
- Compound price is $345.86, which is up by 11.07% in last 24-hour time-frame and 43.38% up from the previous week
- COMP/BTC pair is negative with a loss of 4.52% in Monday’s trading session (0.009991)
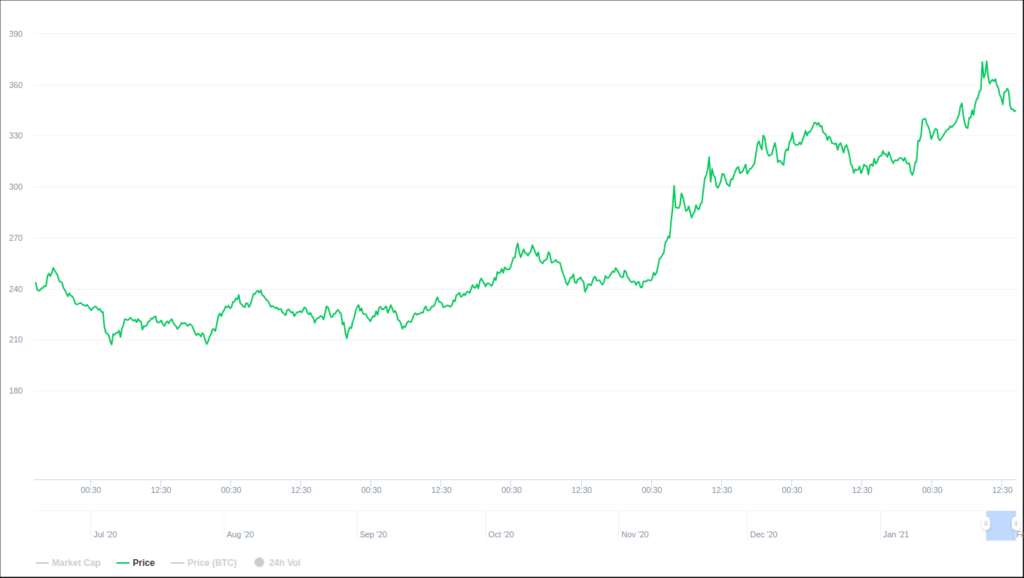
Compound had positive momentum on the weekly chart, and it went up to $374.41 on February 01, 2021, while breaking above the resistance zones created in the past. COMP price set a mark of a 52-week high. Meanwhile, the trading volume of $437,066,583.65 in the last 24-hour time-frame represents a decreasing value of 7.23%. The COMP/ETH pair is in an uptrend with a value of (0.2590) which is down by 2.12% in Monday’s trading session.

Compound Technical Chart Indicates A Positive Momentum
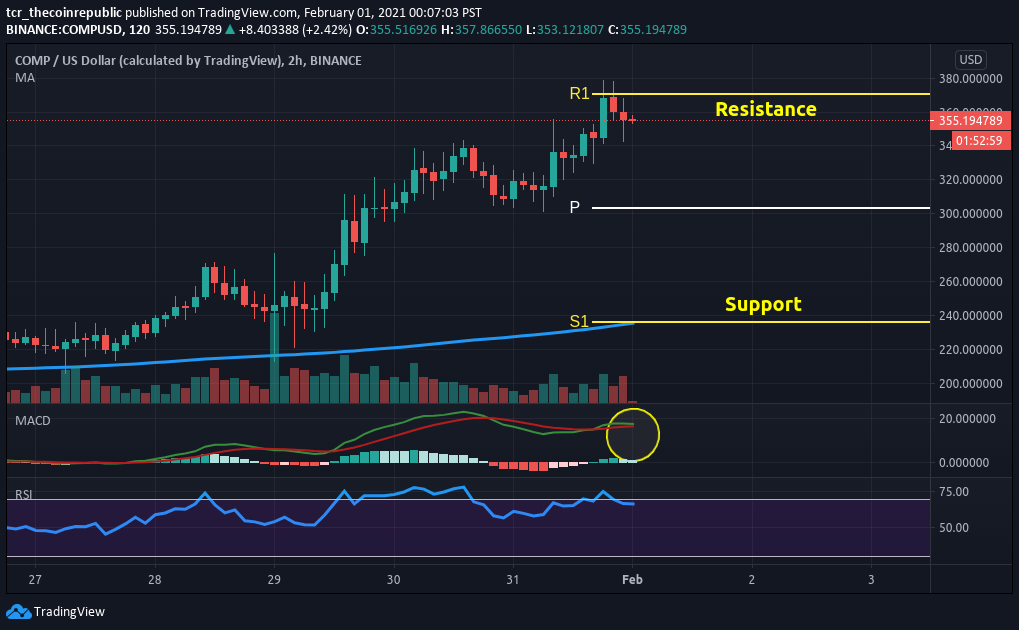
The technical chart of Compound highlights a positive trend. In contrast, COMP price is at $345.86. According to pivot points, the key support level for COMP is placed at $236.34. If it moves up, the key resistance level to watch is $370.36. While Diving into the weekly chart of a 15-minute time frame, it completes a bullish engulfing candlestick pattern, indicating the bears have overwhelmed the bulls and are now in control.

Volume indicator with the value (4.565K) reflects a selling volume in coin. Investors can further expect a decrease in selling volume in the upcoming trading sessions.
SMA-200, price is at $235.32, which acts as another strong support in the coin. The price is above the SMA, and investors can expect a bullish trend in the coin for the upcoming trading session.
MACD (Bullish): bullish crossover signal line was spotted on February 01, 2021, during the trading session it indicated a buy signal in the coin. Also, it denotes the ending of green bars on Histogram.
Meanwhile, the RSI (Bullish): with a value of 66.93 indicates a buy signal in the coin. It may move towards the neutral territory if further selling increases in upcoming trading sessions.
Conclusion
Compound price is up by 11.% on Monday’s trading session. The price is above the SMA and has hit the resistance level of $370.36 and now is on a short term recovery mode. Investors can watch the price move below the resistance level. All technical indicators suggest a buy signal in the coin for the upcoming trading session.
Resistance: $370.36
Support: $236.34
Mr, Nikhil Ingole is a Chief Editor at The Coin Republic with over five years of technical analysis & trading experience in Forex and Crypto. As a commerce graduate, he has taken a keen interest in blockchain’s future potentials in the financial industry. A keen cryptocurrency enthusiast, he is very supportive of new media projects, pioneer ideas and the Bitcoin community. He possesses strong technical, analytical skills and is well known for his financial market’s informative analysis. Other than crypto, Nikhil Loves to watch his favorite football team and keep up to date with the latest Formula 1 racing.


