
 Home
Home News
News

- VET showed positive momentum on today’s trading session.
- Vechain price is $0.02825, which is up by 6.33% in last 24-hour time-frame and 2.43% up from the previous week
- VET/ETH pair is trading negative with a loss of 6.87% in today’s trading session 0.00001972 ETH
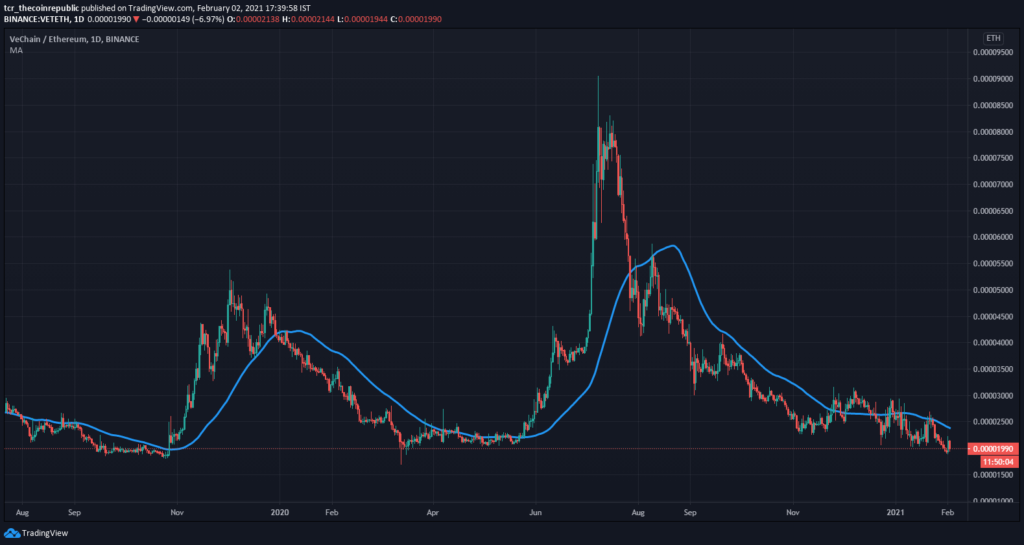
VET had positive momentum on the weekly chart, and it went up to $0.03653 on January 18, 2021, while breaking above the resistance zones created in the past. Vechain announcement of sync two and the increasing popularity of Vulcanverse helped vet to reach new highs. The trading volume is $511,274,534 in the last 24-hour time-frame and represents an increase in the value of 48.98%. The VET/ETH pair is in a downtrend with a value of (0.00001972) and trading near the major support region.

Vechain Technical Chart Indicates a Negative Momentum
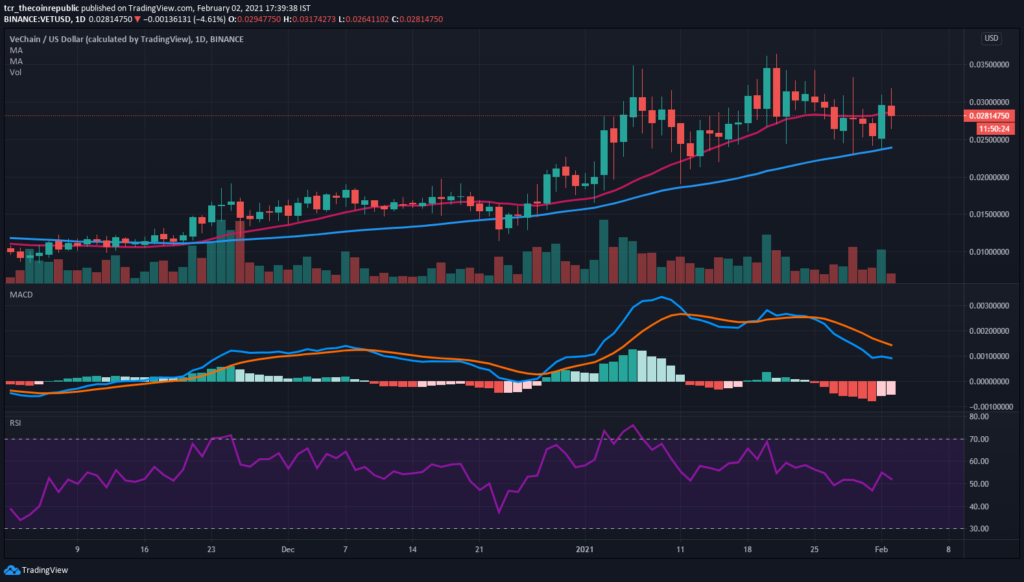
The technical chart of VET highlights a negative trend. VET price is taking support at 20 MA and trailing above 50 MA. The critical support level for VET is placed at $0.0248. If it moves up, the key resistance level to watch is $0.0349. While Diving into the daily chart of 4 hr time frame, it forms a doji candlestick pattern, indicating the dilemma in investors and strength of the bear.

Volume indicator with the value (91.56M) reflects a selling volume in coin due to the overall market’s conditions. Investors can further expect an increase in Selling volume in the next few trading sessions.
Volume indicator with the value (91.56M) reflects a selling volume in coin due to the overall market’s conditions. Investors can further expect an increase in Selling volume in the next few trading sessions.
MACD (Bearish): A bearish crossover signal line was spotted on MACD a trading session back. Bars of the histogram are on the red zone with a higher length which showcases the downtrend’s strength.
RSI (Bearish): It is trading at a value of 52.27 indicating bearish momentum. It may move towards the oversold territory if further selling increases in upcoming trading sessions.
Conclusion
Vechain price is up by 6.33% in today’s trading session. The price is testing the support level of $0.0258 and can pullback or breakdown. Investors can see the price move towards the resistance level of $0.03653, and if it breaks below, it can hit $0.0248. All technical indicators suggest a sell signal in the coin.
Technical Levels
Resistance: $0.03653
Support:$0.0248

Adarsh Singh is a true connoisseur of Defi and Blockchain technologies, who left his job at a “Big 4” multinational finance firm to pursue crypto and NFT trading full-time. He has a strong background in finance, with MBA from a prestigious B-school. He delves deep into these innovative fields, unraveling their intricacies. Uncovering hidden gems, be it coins, tokens or NFTs, is his expertise. NFTs drive deep interest for him, and his creative analysis of NFTs opens up engaging narratives. He strives to bring decentralized digital assets accessible to the masses.


