
 Home
Home News
News
- XRP after a sharp rally it tested the higher level of $0.7448
- It again retested 100-DMA, bounced back
- The XRP/BTC pair is trading at the price levels of 0.00001030 BTC with intraday loss of -0.78%
XRP Current Price Analysis
XRP price dumped after testing high of $0.7448 and now holding major moving averages of 20,50,100 and 200, presently trading above all moving averages. XRP may continue its bullish move from the current levels if it successfully trades above all moving averages. Support on lower levels is placed at $0.29 and $0.24, while resistance is set at $0.49 and $0.60. XRP is presently placed at the 5th rank in account of market capitalization.

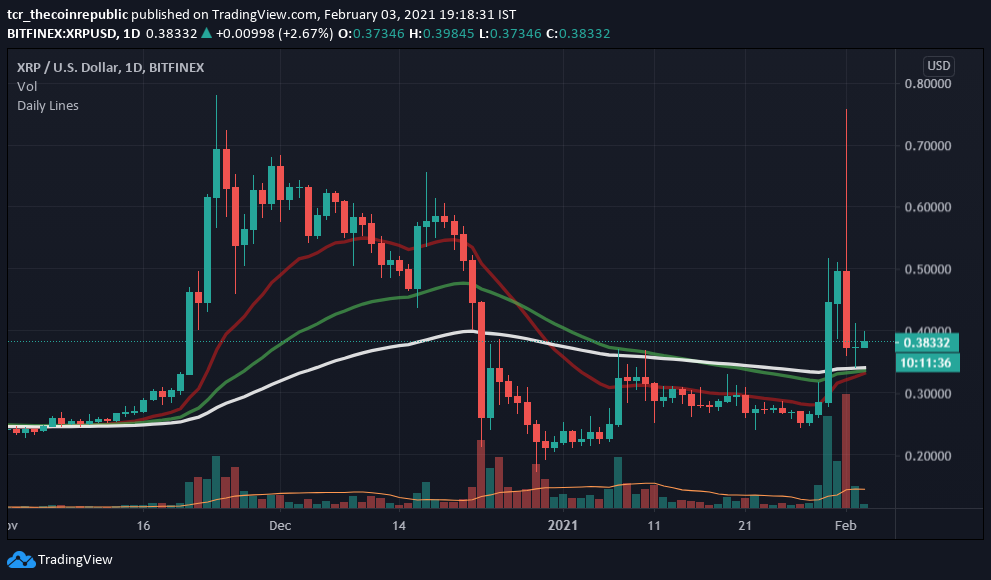

XRP on the daily chart is trading in a sideways trend after a sharp fall from higher levels. XRP is currently trading at $0.3944 with an intraday gain of +7%. Likewise, the volume traded is $16.1 billion. The market capitalization of $18.48 billion, the support the world level is placed at $0.37 and $0.34 is acting as strong support on the daily chart. Meanwhile, the resistance on the higher level is placed at $0.42 and $0.44.
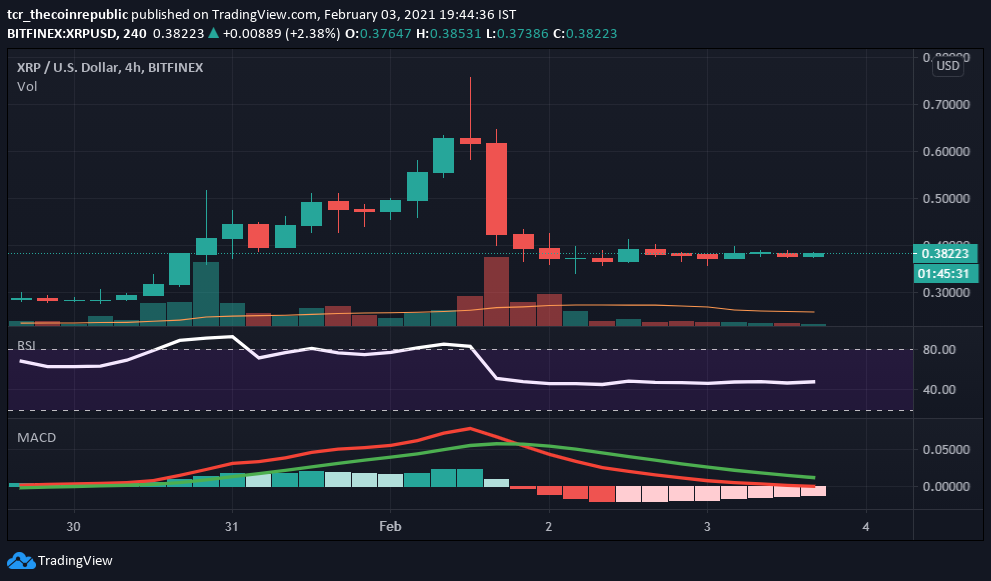
Relative Strength Index (Bullish) indicates a bullish momentum while trading at 59.86. However, it is currently heading towards the overbought zone after recovering from lower levels.
Moving Average Convergence Divergence (Bullish) currently indicates a Bullish trend on the daily chart as giving a positive crossover with the significance of buying signal line (green) over sellers line(red) with no sign of weakness.
Support levels: $0.29 and $0.24
Resistance levels: $0.49 and $0.60.
Mr. Pratik chadhokar is an Indian Forex, Cryptocurrencies and Financial Market Advisor and analyst with a background in IT and Financial market Strategist. He specialises in market strategies and technical analysis and has spent over a year as a financial markets contributor and observer. He possesses strong technical analytical skills and is well known for his entertaining and informative analysis of the Financial markets.


