
 Home
Home News
News

- Litecoin posting strong uptrend following by the overall crypto market and hits the new all-time high of $195
- The pair of LTC/BTC is trading on a bullish note while facing the resistance of 50-EMA standing at 0.003953 BTC gains over +6.59% in intraday
- Litecoin is showcasing a strong bullish rally followed by a rising support line
Bullish rally: Litecoin
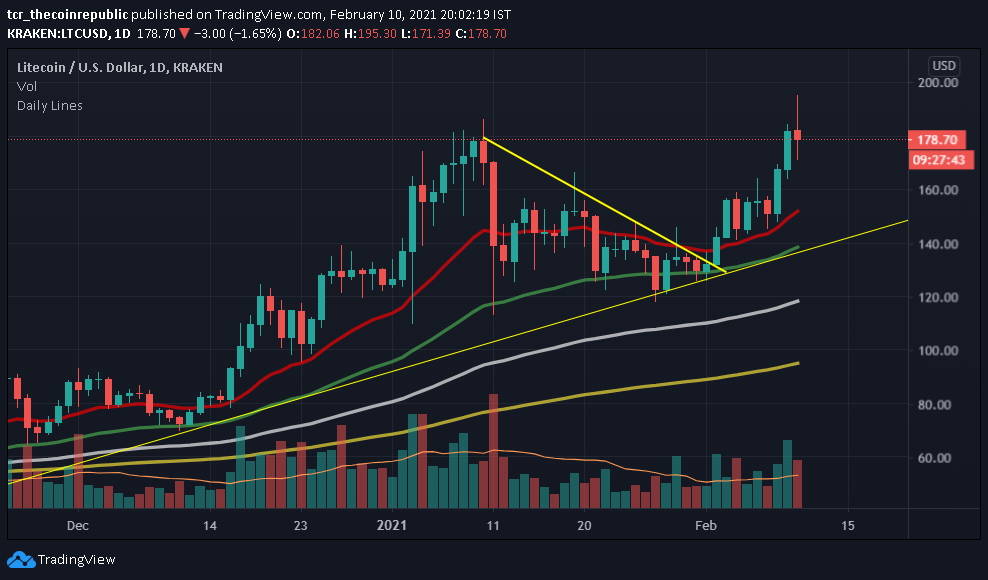
Litecoin is showcasing a strong bullish rally followed by a rising support line, after hitting the new 52-week high it slips from higher levels. LTC after settling above the 20-Day Moving Averages (DMA) posted a strong rally while trading above the 20,50,100 and 200-DMA. The support on lower levels are situated at $152 and $138, likewise, major support is placed around $118. The resistance on a higher slide can be considered of $220 and $260. Whereas the open interest on Litecoin futures hits a record high of $584 million. On the other hand, the major institutional investors like Bitwise and Grayscale Investments are interested in the altcoin.

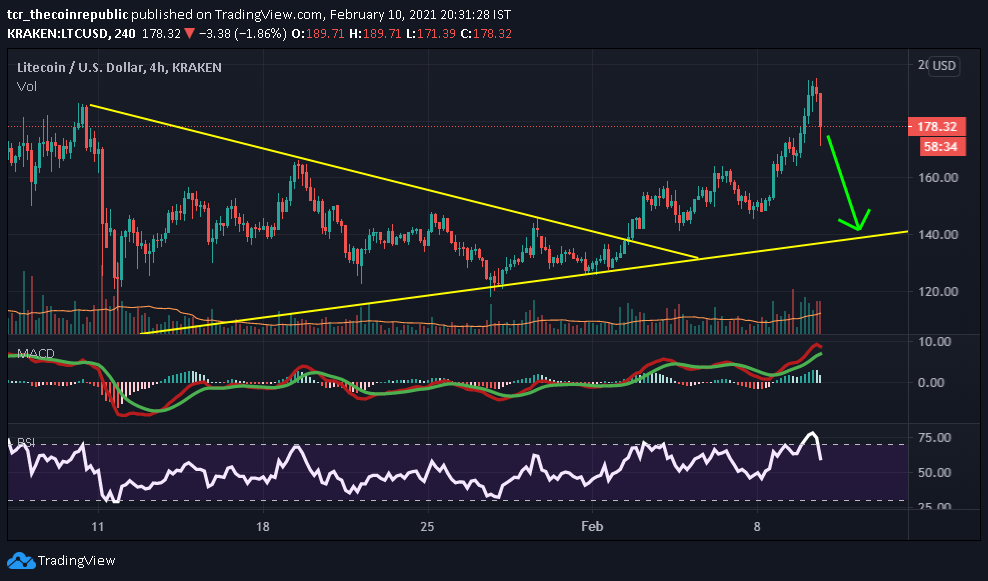
LTC over the 4-hour time frame had broken out from the triangle pattern. As a result, a strong rally was observed. However, after hitting the new 52-week high, sudden selling pressure is observed from higher levels which formed a bearish engulfing candle over the daily chart. The volume recorded in the last 24-hour period jumped over +4% standing at $9.94 billion, likewise the total market capitalization stands at $11.87 billion which is placed on 8th rank.

Relative Strength Index (Bearish) indicates a bearish Momentum while trading at 60.93. However, it is currently heading towards an oversold zone after testing the overbought zone with no sign of recovery.
Moving Average Convergence Divergence (Bearish) currently indicates a bearish trend on the daily chart as giving a negative crossover with the significance of the seller’s signal line (red) over Buyer’s line (green).
Support levels: $152, $138 and $118
Resistance levels: $220 and 260
Mr. Pratik chadhokar is an Indian Forex, Cryptocurrencies and Financial Market Advisor and analyst with a background in IT and Financial market Strategist. He specialises in market strategies and technical analysis and has spent over a year as a financial markets contributor and observer. He possesses strong technical analytical skills and is well known for his entertaining and informative analysis of the Financial markets.


