
 Home
Home News
News

- BAT prices recently rose by 60%-65% after giving a breakout from a cup pattern
- The rally was followed by a profit booking which resulted in a formation of another pattern
- Another breakout may come soon, considering lower volumes and rising prices
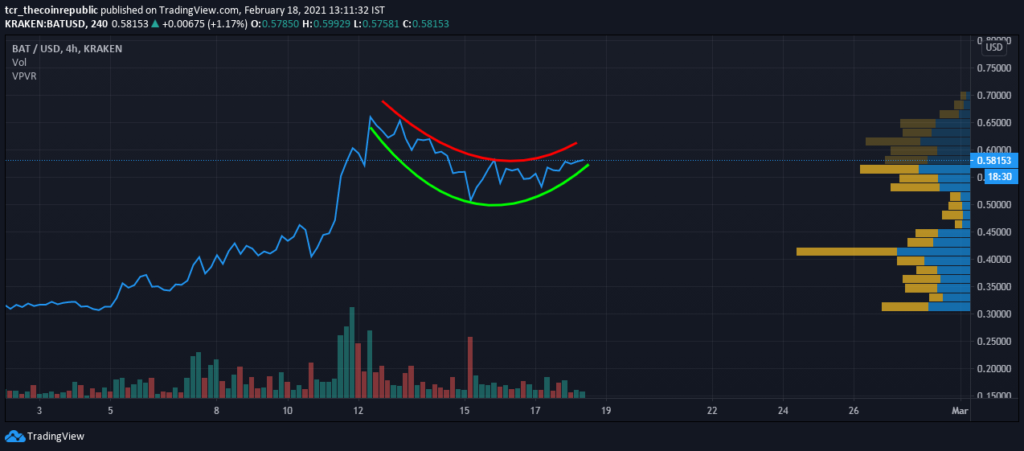
BAT price is undergoing a profit booking which made a cup-like pattern on the 4-hour chart. The coin is also witnessing some fresh buying that can give another breakout. The market cap and 24-hour volume of the coin are $869,178,630 and $496,371,789 respectively.

BAT Price Due To Break Resistance, Indicators Favour
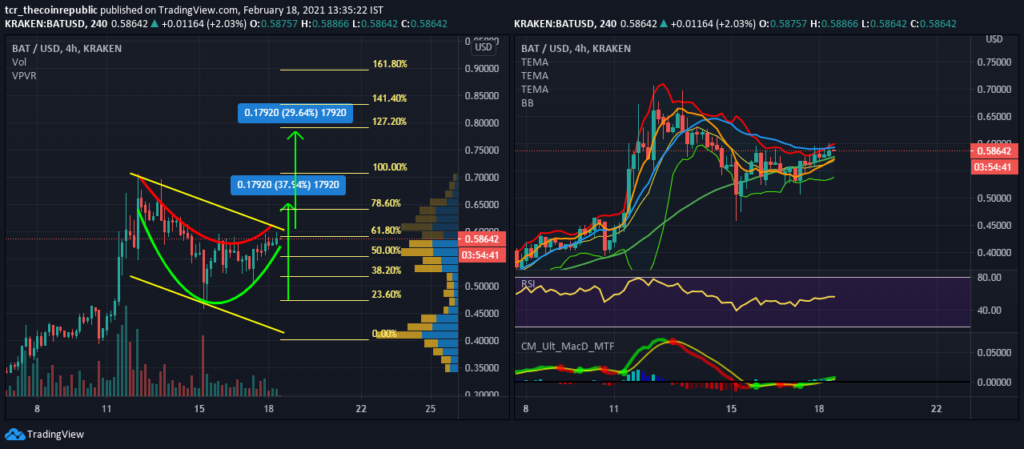
BAT price is due to breaking out of the resistance of the curve. The coin is making doji candles which are creating indecisiveness amongst the traders. A breakout can cause a surge of 30% in the coin if it’s successful.

The price is sustaining above 20EMA and 200EMA, which provides support at $0.56 and $0.57. The 50EMA is a resistance for the price at $0.59. A crossover of 20EMA over 50EMA may bring in fresh buying in the coin.
The Bollinger Band favours bull run, as the price is above the median(10EMA) and lower band. The two bands are supporting the coin at $0.566 and $0.53. The upper band imposes the resistance at $0.599.
RSI is surging after taking support from the 38-42 levels. Currently, it is at 56.68 and may find immediate resistance at 68, followed by 80.
MACD(8,21,5) has flashed green for the bulls. The crossover has been done at 0 level, which increases the possibility of a strong bull run. The previous top of MACD is at 0.05-0.06.
Conclusion –
BAT coin has made a cup pattern which may have a possible breakout in the upcoming days. The indicators support breakout, while price action suggests indecisiveness.
Support: $0.57-$0.5688(10EMA, 20EMA and 200EMA)
Resistance: $0.65, $0.7 and $0.8(Fibonacci Levels) and $0.59(50 EMA and Upper BB)


