
 Home
Home News
News

- Dogecoin price has broken out of a flag pattern and made its first doji candle above the flag
- The breakout rose Dogecoin price by 20% but saw some resistance, should wait for a further breakout
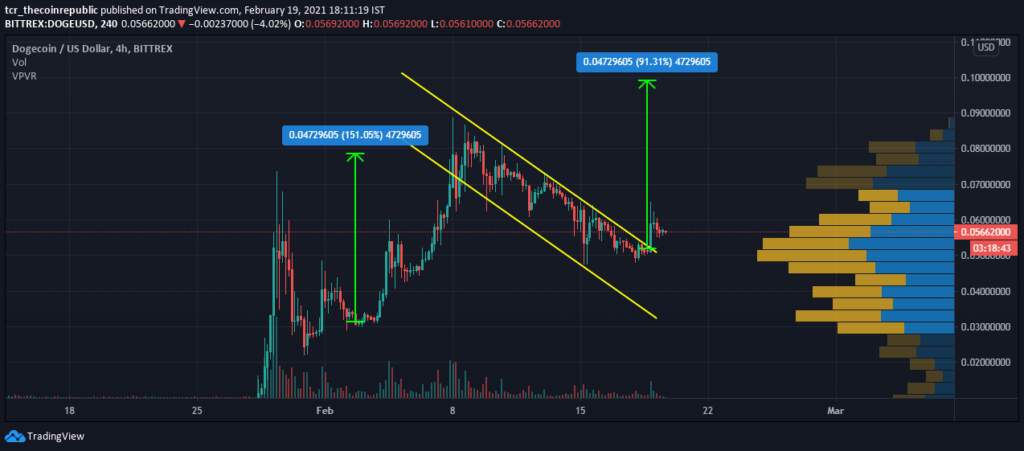
The line chart is plotted on a 4-hour time frame. Dogecoin price gave a breakout from the flag, and pole pattern is expected to see a 91% rally. The volume analysis shows that higher volume confirmed the breakout, and a greater proportion of the total volume comprised buyers than the seller. However, a minor difference between buying and selling volume may cause consolidation. The 24-hour volume and market cap are $$7,128,670,417 and $15,408,539,831 respectively.

Hurdle For Dogecoin Price? The EMAs
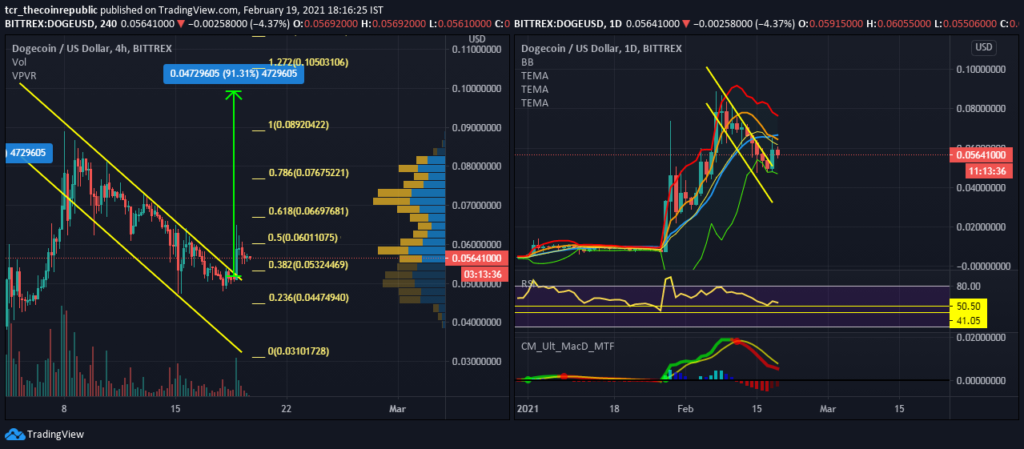
Left Image: The 4-hour time frame chart shows a clear breakout of the dogecoin, which faced resistance because of the Fibonacci level – 61.8% and 50%, the coin has to mandatorily sustain above the flag initiate a bull run or else it may collapse.

Right Image: The daily time frame chart shows that the price faces resistance from the 20EMA and 50EMA, which hover at $0.0645 and $0.0666, respectively.
The bearish crossover failed to initiate a descent; thus, the possibility of consolidation higher over the reversal.
The price is also below the median of Bollinger base. The median is a ten days EMA, a possible resistance for the coin at $0.06175, followed by the upper band at $0.0765. The lower band provides support at $0.0469. The bands aren’t contracted nor expanding; this suggests that the current trend(consolidation) is likely to persist unless the price surges over the median.
The RSI is 55.62, which receives support at 50 and 40. The resistance for the indicator is at 80 and 90 levels.
The MACD(8,21,5) is making a positive divergence; i.e. the prices increase, so as the signal line, which was earlier falling. The signal line is headed towards the slow line, which can signal green for the bulls(when the prices surge over EMA).
Conclusion –
Dogecoin price has given a breakout from the flag and pole pattern but didn’t continue the rally as it received strong, resistant forces from 61.8% Fibonacci level followed by the EMAs. A strong rally may occur once the price surge above the Fibonacci levels and EMA – 10, 20 and 50.
Resistance: $0.06 and $0.0669(Fibonacci level) and $0.0614-$0.666(10EMA, 20EMA and 50EMA)
Support: $0.0469(Lower BB) and $0.0532(38.2% Fibonacci level)


