
 Home
Home News
News

- Band Protocol bounced back to $14.19 from the support of $10.96 on Wednesday’s trading session
- The 24-hour volume in BAND is at $103,471,591 with a 43.57% decrease.
- The BAND/BTC pair was trading at 0.000257 BTC with a loss of 7.39%
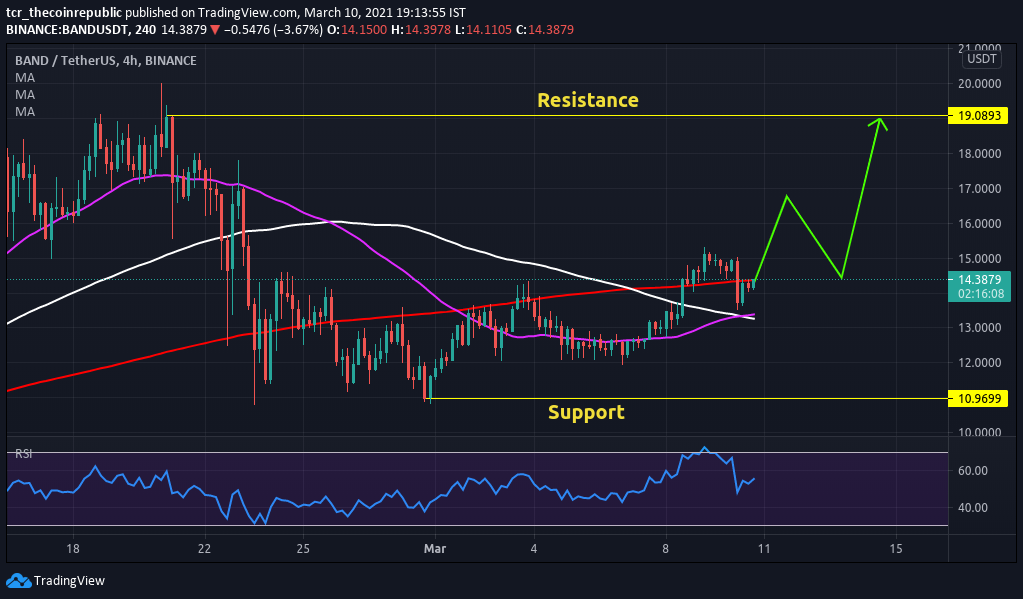
The 4-hour technical chart of BAND price projects an uptrend. According to pivot points, BAND’s critical support level is placed at $10.96. Whereas if it moves up, the key resistance level to watch is $19.08. While diving into the weekly chart of a 4-hour time-frame, it completes a bearish engulfing candlestick pattern.

SMA-50 & 100 acts as another strong support in the coin. SMA-50 (purple) intersects the SMA-100 (white), which projects a beginning of a bullish trend. The price is above the SMA’s. Investors may perceive a positive crossover in the chart, the price will also follow the positive trend.

RSI indicator (BULLISH), with a value of 53, indicates a buy signal in the coin. Moreover, Investors can see a flat line in the index, it may surge more in future trading sessions.
Band Protocol Price Is Going To Explode
Band Protocol price traded at $14.19 with a loss of 4.71% in the last 24-hour. In contrast, the market capitalization stands at $29 million. Technically, investors can perceive a positive crossover in SMA. Moreover, the movement of price can be towards the resistance of $19.08.
Resistance: $19.08
Support: $10.96
Mr, Nikhil Ingole is a Chief Editor at The Coin Republic with over five years of technical analysis & trading experience in Forex and Crypto. As a commerce graduate, he has taken a keen interest in blockchain’s future potentials in the financial industry. A keen cryptocurrency enthusiast, he is very supportive of new media projects, pioneer ideas and the Bitcoin community. He possesses strong technical, analytical skills and is well known for his financial market’s informative analysis. Other than crypto, Nikhil Loves to watch his favorite football team and keep up to date with the latest Formula 1 racing.


