
 Home
Home News
News

- MKR performed negatively on MAR 11, 2021 trading session while making a 52 week high on Feb 20,2021
- Maker price is $2129.14, which is down by 3.92% in the last 24-hour time-frame and 3.21% up from the previous week
- MKR/BTC pair is performing negative with a loss of 4.60% in Thursday’s trading session (0.03832 BTC)
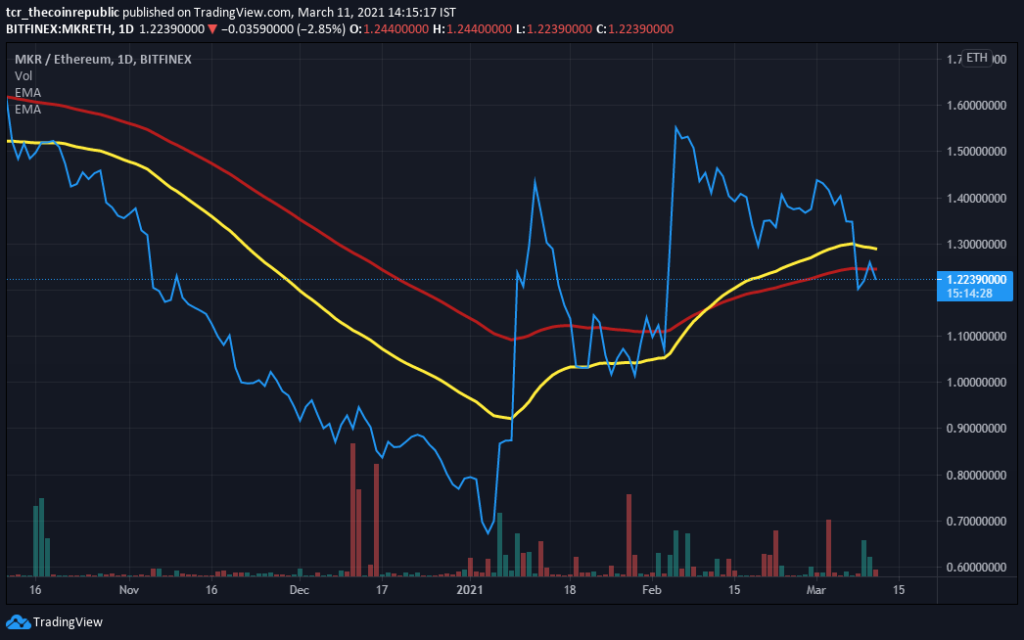
Maker had positive momentum on the weekly chart, and it went up to $2317 on March 11, 2021, while breaking above the resistance zones created in the past. Whereas, Maker price set a mark of an all-time high on Feb,20,2021. Meanwhile, the trading volume of MKR is $113,720,986 in the last 24-hour time-frame representing a increase in the value of 11.84%. The MKR/ETH pair is down with a value of (1.182 ETH) which is 0.26% in today’s trading session.

TECHNICAL CHART INDICATES A CONSOLIDATED TRAP FOR MAKER PRICE
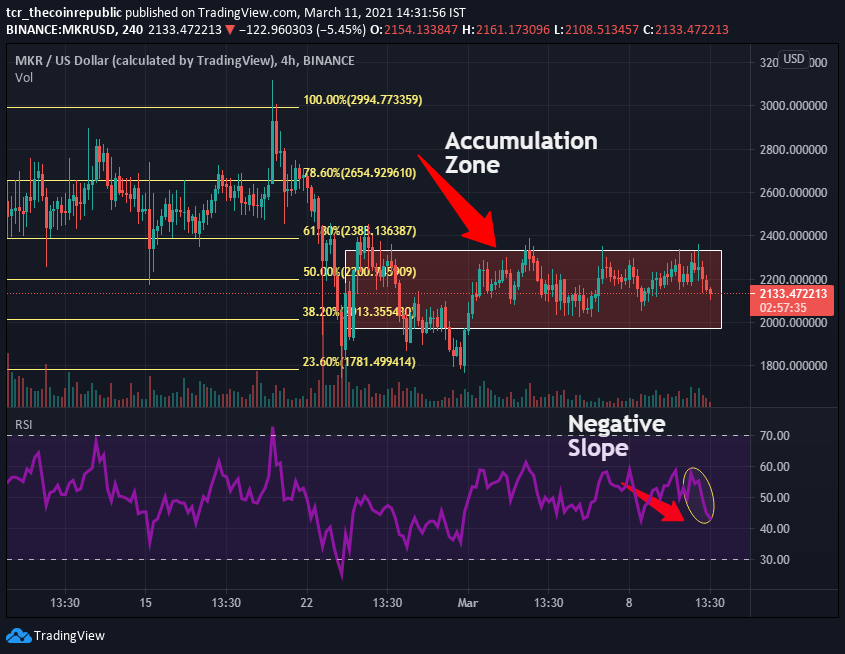
The technical chart of Maker highlights a consolidatedtrend. In contrast, Maker price is at $2134.61. According to fibonacci level, the critical support level for MKR is placed at 0.382fib, whereas if it moves up, the key resistance level to watch is $2400. While diving into the weekly chart of a 4-hour time-frame, it formed a supply zone.If the price goes above the supply zone than price can see a 10% upside.If the price goes below the supply zone than a strong downside movement can be seen.

Volume indicator with the value (2.178K) reflects a low selling volume in coin. Investors can expect an increase in buying volume in the upcoming trading sessions.
SMA-50, price is at $2036, which acts as another strong support in the coin. The price is above the SMA, and investors can expect a bullish trend in the coin.
Meanwhile, the RSI indicator (Bearish) with a value of 44.52 indicates a bearish signal in the coin.There is a negative slope in the RSI which showcases that the price can observe a downtrend.One can wait until a significant positive slope is observed in the RSI.
CONCLUSION
Maker price is down by 3.67% on Thursady’s trading session. The price is above the 100 SMA of $1664. MKR/ETH pair is performing negative and one can expect a further downtrend.Investors may expect a rise in upcoming trading sessions.One should do their own research before investing.
Technical Levels
Resistance: $2500.00
Support: $1800.00

Adarsh Singh is a true connoisseur of Defi and Blockchain technologies, who left his job at a “Big 4” multinational finance firm to pursue crypto and NFT trading full-time. He has a strong background in finance, with MBA from a prestigious B-school. He delves deep into these innovative fields, unraveling their intricacies. Uncovering hidden gems, be it coins, tokens or NFTs, is his expertise. NFTs drive deep interest for him, and his creative analysis of NFTs opens up engaging narratives. He strives to bring decentralized digital assets accessible to the masses.


